Titans Focused NFL Data Analysis
Welcome to my page. Use the Contents links below or the top navigation bar to move through the sections. The page is readable, but not optimized for mobile screens. On a large screen, some portions may look better in portrait orientation. Python was used for data analysis, graphs, and page creation itself. See the repository for more information on the code and process. It can also be used to submit feedback.
Contents
- Acknowledgements
- Data used to power analysis.
- 2022 Regular Season Review
- Team evaluations using metrics calculated from NFL play-by-play data for the 2022 regular season
- Titan Careers by AV
- Nostalgic exercise identifying Titans legends using Pro-Football-Reference franchise AV metric normalized by games played.
- Punter Analysis
- Extensive punter data analysis using NFL play-by-play data. Focus on former and current Titans, Brett Kern and Ryan Stonehouse. Puntalytics advanced punting metrics not up-to-date for 2022
- Part I
- Brett Kern's Titans history
- Part II
- Kern's Pro Bowl years ('17-19) vs Ryan Stonehouse
- Punters are Players, Titans - Bonus Stats
- Part III
- Ryan Stonehouse's season relative to the NFL
- Punters are Players, 2022 - Bonus Stats
- Playground
- Unfinished Explorations: Ideas / Graphs / Tables with minimal explanation. Things to become future sections?
Acknowledgements
- Data Sources & Methods
- nflverse play-by-play, team colors
- nflfastR play-by-play field descriptions
- Puntalytics punt data processing, punting metrics+team logos
- Pro-Football-Reference Oilers/Titans career AV table, and useful reference
Regular Season Review - Team Metrics 2022
2022 play-by-play dataset, regular season only
Team performance for 2022 is gauged in a few different ways. In the first section Expected Points Added (EPA) for Offense, Defense, and Special Teams
is considered in total and on a per play basis. Plays with penalties were excluded.
Next, each drive is analyzed for each team on Offense and Defense. The second section
focuses on the numerical data, Yards, Points, and Time of Possesion per drive. And the various drive outcomes are examined in the
third section. In the future, I might take a similar approach to team performance on a per series basis.
Lastly, penalties and their consequences were tallied. Penalty data is presented from
the persepective of the committing team, and not the team benefitting.
Expected Points Added
The first section shows, expected points added, EPA, for teams in various situations. Offense was split into passes, runs, and scrambles. Defense was split into pass and runs. And finally Special Teams plays were categorized into "Offense", where a team is trying to score or will be receiving the ball, and "Defense" where a team is doing the opposite. Those values were largely influenced by punter (Def) and kicker (Off) performance.
EPA was calculated on a per play basis, and also as a season total. For most categories, these metrics are interchangeable over the span of the season. But for scrambles, where teams have more spread in play counts, the totals and averages are not proportional. For the most part, EPA data is presented on a per play basis, but totals are shown in some of the graphs. Use the toggle text to switch between EPA/play and Total EPA in the table below.
The graph shows the average EPA/play for each team on Defense and Offense. It is styled after rbsdm.com's Team Tiers. All the EPA data is presented in the following table; and additional graphs are shown after the table.

Team EPA 2022 change to Total EPA
Table is currently sorted by Def_EPA, click other columns to sort table. good OK bad
| Team | Off_EPA | Off_EPA_pass | Off_EPA_run | Off_EPA_scramble | Def_EPA | Def_EPA_pass | Def_EPA_run | ST_Off_EPA | ST_Def_EPA | |
|---|---|---|---|---|---|---|---|---|---|---|
 |
SF | 102.4 | 103.9 | -3.5 | 1.9 | -130.9 | -69.3 | -61.6 | 7.4 | -1.2 |
 |
DAL | 39.5 | 45.3 | -3.5 | -2.4 | -121.6 | -72.3 | -49.3 | 10.7 | 9.2 |
 |
NE | -42.1 | -24.5 | -21.1 | 3.5 | -106.9 | -77.5 | -29.4 | 29.9 | 39.7 |
 |
WAS | -91.9 | -61.9 | -39.6 | 9.5 | -76.6 | -31.8 | -44.9 | -4.6 | 7.0 |
 |
PHI | 97.6 | 35.5 | 37.4 | 24.8 | -76.0 | -102.5 | 26.5 | 11.7 | 19.2 |
 |
NO | -48.0 | -0.3 | -46.6 | -1.0 | -70.6 | -58.9 | -11.7 | 5.7 | 29.5 |
 |
BUF | 106.1 | 72.3 | -18.8 | 52.6 | -70.4 | -30.0 | -40.4 | 33.6 | -13.9 |
 |
NYJ | -93.3 | -70.7 | -31.8 | 9.2 | -63.3 | -61.3 | -2.1 | 20.9 | 14.9 |
 |
DEN | -113.7 | -83.2 | -42.0 | 11.5 | -59.5 | -44.7 | -14.8 | -24.8 | 23.8 |
 |
CIN | 65.8 | 74.3 | -20.1 | 11.6 | -55.7 | -36.0 | -19.7 | 11.8 | 24.3 |
 |
IND | -186.4 | -122.3 | -68.4 | 4.3 | -47.0 | -13.5 | -33.4 | 22.9 | 16.2 |
 |
KC | 191.0 | 164.8 | -8.1 | 34.3 | -23.6 | -17.2 | -6.4 | -37.0 | 10.0 |
 |
JAX | 37.8 | 59.0 | -28.5 | 7.3 | -14.1 | 13.3 | -27.3 | 4.6 | 8.1 |
 |
MIA | 22.4 | 39.4 | -21.0 | 3.9 | -12.3 | 1.8 | -14.1 | 17.0 | 30.5 |
 |
BAL | -5.3 | -28.7 | 13.2 | 10.2 | -7.7 | 18.3 | -25.9 | 36.8 | -5.6 |
 |
TEN | -71.0 | -46.3 | -37.0 | 12.2 | -5.2 | 39.3 | -44.5 | -0.6 | -2.6 |
 |
TB | -42.5 | 31.9 | -69.0 | -5.3 | -4.7 | 14.0 | -18.7 | -11.6 | 24.6 |
 |
CAR | -53.0 | -55.0 | -4.3 | 6.4 | -2.2 | 21.6 | -23.8 | 15.4 | -15.7 |
 |
HOU | -193.7 | -121.1 | -78.1 | 5.5 | -0.4 | -7.8 | 7.4 | 22.4 | -7.3 |
 |
CLE | 11.1 | -24.2 | 9.8 | 25.5 | -0.1 | -21.1 | 21.0 | 1.6 | 4.5 |
 |
LAC | -4.1 | 17.4 | -26.1 | 4.6 | 4.9 | -32.9 | 37.8 | 8.8 | 7.0 |
 |
ARI | -85.4 | -80.8 | -23.0 | 18.4 | 9.8 | 15.5 | -5.6 | 8.9 | 32.0 |
 |
LAR | -85.8 | -69.2 | -20.0 | 3.4 | 18.4 | 30.4 | -12.0 | 24.6 | 33.4 |
 |
GB | -4.8 | -18.2 | 2.4 | 11.0 | 19.4 | -20.4 | 39.8 | 12.0 | 12.7 |
 |
PIT | 5.2 | -11.4 | 7.9 | 8.8 | 23.5 | 47.6 | -24.1 | -2.7 | 34.0 |
 |
MIN | -27.8 | 16.4 | -52.5 | 8.3 | 28.2 | 36.8 | -8.6 | 12.5 | 32.9 |
 |
NYG | 49.5 | 2.7 | 8.3 | 38.4 | 42.9 | 4.0 | 38.9 | 8.0 | 14.0 |
 |
SEA | 4.6 | 8.2 | -23.9 | 20.3 | 47.2 | 28.9 | 18.3 | 16.3 | -21.5 |
 |
LV | -0.8 | 1.3 | -10.4 | 8.4 | 63.6 | 68.4 | -4.8 | 33.5 | -8.4 |
 |
ATL | -12.7 | -19.9 | 7.3 | -0.1 | 77.0 | 69.2 | 7.8 | 28.8 | 9.8 |
 |
DET | 63.5 | 92.6 | -25.2 | -3.8 | 78.2 | 31.8 | 46.3 | 29.6 | 3.7 |
 |
CHI | -50.8 | -100.5 | 3.2 | 46.5 | 118.9 | 83.3 | 35.6 | 5.1 | -5.7 |
| Team | Off_EPA | Off_EPA_pass | Off_EPA_run | Off_EPA_scramble | Def_EPA | Def_EPA_pass | Def_EPA_run | ST_Off_EPA | ST_Def_EPA | |
|---|---|---|---|---|---|---|---|---|---|---|
|
SF | 0.094 | 0.183 | -0.007 | 0.136 | -0.123 | -0.104 | -0.156 | 0.031 | -0.005 |
|
DAL | 0.034 | 0.074 | -0.007 | -0.119 | -0.106 | -0.109 | -0.101 | 0.043 | 0.037 |
|
NE | -0.043 | -0.043 | -0.056 | 0.182 | -0.101 | -0.120 | -0.070 | 0.135 | 0.173 |
|
WAS | -0.082 | -0.103 | -0.080 | 0.340 | -0.079 | -0.058 | -0.106 | -0.020 | 0.031 |
|
PHI | 0.089 | 0.062 | 0.079 | 0.576 | -0.073 | -0.166 | 0.062 | 0.051 | 0.090 |
|
NO | -0.048 | -0.001 | -0.106 | -0.073 | -0.067 | -0.102 | -0.024 | 0.025 | 0.136 |
|
BUF | 0.099 | 0.112 | -0.050 | 0.993 | -0.067 | -0.046 | -0.102 | 0.145 | -0.066 |
|
NYJ | -0.089 | -0.106 | -0.087 | 0.485 | -0.060 | -0.103 | -0.004 | 0.094 | 0.065 |
|
DEN | -0.107 | -0.132 | -0.105 | 0.410 | -0.057 | -0.071 | -0.035 | -0.105 | 0.099 |
|
CIN | 0.061 | 0.108 | -0.056 | 0.429 | -0.053 | -0.059 | -0.046 | 0.053 | 0.106 |
|
IND | -0.171 | -0.185 | -0.169 | 0.217 | -0.044 | -0.023 | -0.069 | 0.100 | 0.074 |
|
KC | 0.179 | 0.246 | -0.023 | 0.762 | -0.022 | -0.026 | -0.016 | -0.154 | 0.046 |
|
JAX | 0.034 | 0.088 | -0.066 | 0.304 | -0.012 | 0.019 | -0.058 | 0.020 | 0.037 |
|
MIA | 0.021 | 0.060 | -0.056 | 0.207 | -0.011 | 0.003 | -0.033 | 0.069 | 0.128 |
|
BAL | -0.005 | -0.052 | 0.027 | 0.243 | -0.007 | 0.027 | -0.063 | 0.160 | -0.025 |
|
TEN | -0.074 | -0.093 | -0.084 | 0.530 | -0.005 | 0.056 | -0.119 | -0.003 | -0.012 |
|
TB | -0.035 | 0.038 | -0.185 | -1.331 | -0.004 | 0.022 | -0.040 | -0.048 | 0.106 |
|
CAR | -0.055 | -0.114 | -0.010 | 0.375 | -0.002 | 0.036 | -0.051 | 0.068 | -0.066 |
|
HOU | -0.193 | -0.197 | -0.211 | 0.261 | -0.000 | -0.014 | 0.014 | 0.102 | -0.031 |
|
CLE | 0.010 | -0.042 | 0.020 | 0.751 | -0.000 | -0.039 | 0.046 | 0.007 | 0.021 |
|
LAC | -0.003 | 0.022 | -0.069 | 0.244 | 0.005 | -0.056 | 0.081 | 0.036 | 0.028 |
|
ARI | -0.076 | -0.115 | -0.060 | 0.471 | 0.009 | 0.025 | -0.013 | 0.040 | 0.141 |
|
LAR | -0.088 | -0.120 | -0.053 | 0.154 | 0.018 | 0.052 | -0.027 | 0.117 | 0.147 |
|
GB | -0.005 | -0.031 | 0.006 | 0.996 | 0.020 | -0.040 | 0.088 | 0.056 | 0.061 |
|
PIT | 0.005 | -0.019 | 0.017 | 0.292 | 0.024 | 0.083 | -0.057 | -0.012 | 0.159 |
|
MIN | -0.024 | 0.022 | -0.136 | 0.553 | 0.024 | 0.053 | -0.018 | 0.050 | 0.127 |
|
NYG | 0.044 | 0.005 | 0.018 | 0.620 | 0.039 | 0.006 | 0.084 | 0.034 | 0.056 |
|
SEA | 0.004 | 0.013 | -0.060 | 0.634 | 0.041 | 0.047 | 0.034 | 0.068 | -0.087 |
|
LV | -0.001 | 0.002 | -0.027 | 0.349 | 0.061 | 0.112 | -0.011 | 0.154 | -0.037 |
|
ATL | -0.013 | -0.045 | 0.015 | -0.004 | 0.072 | 0.121 | 0.016 | 0.132 | 0.045 |
|
DET | 0.060 | 0.153 | -0.057 | -0.295 | 0.074 | 0.053 | 0.102 | 0.132 | 0.017 |
|
CHI | -0.052 | -0.229 | 0.007 | 0.727 | 0.118 | 0.167 | 0.069 | 0.025 | -0.025 |
Team Defense EPA (1/8)

Team Defense EPA - Pass vs Run (2/8)

Team Offense EPA (3/8)

Team Offense EPA - Pass vs Run (4/8)

Special Teams EPA - Def vs Off (5/8)
Def - giving ball / preventing score | Off - getting ball / trying to score

Team Offense Scramble EPA (6/8)

Team Offense Scramble EPA/play (7/8)

Scramble EPA/play vs Scramble Count (8/8)

per Drive Analysis
Team drive results were analyzed for both Offense and Defense. Yards (Yds), points (Pts),
and penalty yards (penalty_yds) per drive are obvious in their intepretation.
TOP is average time of possesion in seconds.
Drives resulting in an immediate punt (three_out), without an offensive score (nopts),
or without positive yards (noyds) are also presented.
Sadly, the Titans offense was worst in three and outs, not scoring, and penalty yards lost per drive. They were not much better in other metrics.
Team offenses and defenses are presented
in the next two tables. They are currently sorted by Pts per drive.
*Note: bigger/smaller isn't obviously better for Off/Def TOP. Pts were estimated by giving 7 for TDs and 3 for FGs, not exactly counted using scores.*
Points per drive (1/6)

Yards per drive (2/6)

Three and Out vs No Scores, Offense (3/6)

Three and Out vs No Scores, Defense (4/6)

Points vs Time of possesion, Offense (5/6)

Points vs Time of possesion, Defense (6/6)

2022 Team Offense, Drive Analysis good OK bad
| Team | Drives | Yds | Pts | TOP | three_out | nopts | noyds | penalty_yds | |
|---|---|---|---|---|---|---|---|---|---|
|
KC | 181 | 38.7 | 2.68 | 171 | 17.1% | 54.1% | 10.5% | -0.2 |
|
BUF | 189 | 36.2 | 2.51 | 164 | 16.4% | 55.0% | 14.8% | -0.1 |
|
PHI | 187 | 35.6 | 2.49 | 167 | 17.1% | 57.8% | 15.0% | 0.2 |
|
DET | 177 | 36.3 | 2.46 | 172 | 16.9% | 57.1% | 14.1% | -0.1 |
|
SF | 196 | 34.2 | 2.40 | 176 | 13.8% | 56.6% | 9.7% | -0.1 |
|
DAL | 207 | 31.8 | 2.38 | 157 | 23.2% | 58.0% | 15.5% | 0.2 |
|
CIN | 185 | 33.1 | 2.34 | 176 | 21.1% | 58.9% | 17.8% | 0.7 |
|
LV | 173 | 33.9 | 2.21 | 181 | 19.7% | 57.2% | 13.3% | -0.7 |
|
SEA | 199 | 31.4 | 2.15 | 158 | 20.1% | 59.3% | 16.6% | -0.4 |
|
JAX | 194 | 33.1 | 2.10 | 165 | 19.6% | 60.8% | 12.4% | -0.2 |
|
MIN | 209 | 31.8 | 2.10 | 154 | 22.5% | 62.7% | 11.5% | 0.8 |
|
MIA | 195 | 33.2 | 2.06 | 161 | 15.9% | 62.1% | 12.3% | 0.1 |
|
NYG | 188 | 31.9 | 2.04 | 176 | 19.7% | 61.7% | 11.7% | -0.6 |
|
LAC | 203 | 31.7 | 2.02 | 163 | 22.2% | 61.6% | 12.3% | 0.1 |
|
ATL | 169 | 32.2 | 1.98 | 181 | 16.0% | 60.9% | 13.6% | 0.2 |
|
GB | 178 | 32.8 | 1.96 | 182 | 15.7% | 64.0% | 13.5% | 0.5 |
|
CLE | 181 | 32.8 | 1.91 | 179 | 19.3% | 65.2% | 14.4% | -0.2 |
|
BAL | 189 | 32.0 | 1.90 | 178 | 14.8% | 61.4% | 13.8% | -0.4 |
|
CHI | 182 | 27.9 | 1.84 | 166 | 23.6% | 65.9% | 19.2% | -0.6 |
|
CAR | 191 | 27.0 | 1.74 | 152 | 28.3% | 64.9% | 17.3% | -0.4 |
|
NO | 186 | 30.3 | 1.73 | 161 | 24.7% | 68.3% | 14.5% | -0.2 |
|
LAR | 177 | 26.8 | 1.70 | 171 | 24.9% | 66.7% | 22.0% | -0.1 |
|
PIT | 181 | 29.8 | 1.65 | 178 | 23.8% | 65.7% | 14.4% | -0.4 |
|
ARI | 188 | 28.4 | 1.64 | 165 | 24.5% | 68.1% | 16.0% | -0.9 |
|
NE | 192 | 27.1 | 1.63 | 155 | 25.5% | 67.2% | 12.5% | -0.8 |
|
TB | 206 | 29.9 | 1.61 | 154 | 25.2% | 68.4% | 13.1% | -0.5 |
|
WAS | 197 | 28.6 | 1.55 | 172 | 20.3% | 70.6% | 16.2% | 0.2 |
|
TEN | 192 | 25.6 | 1.52 | 158 | 30.7% | 72.4% | 18.8% | -1.1 |
|
NYJ | 197 | 27.6 | 1.49 | 151 | 25.9% | 70.1% | 15.2% | -0.4 |
|
DEN | 200 | 27.6 | 1.45 | 152 | 27.0% | 71.0% | 16.5% | 0.1 |
|
HOU | 199 | 24.5 | 1.44 | 148 | 25.6% | 70.9% | 21.1% | 0.3 |
|
IND | 197 | 26.7 | 1.43 | 158 | 21.3% | 70.1% | 14.2% | -0.0 |
2022 Team Defense, Drive Analysis good OK bad
| Team | Drives | Yds | Pts | TOP | three_out | nopts | noyds | penalty_yds | |
|---|---|---|---|---|---|---|---|---|---|
|
SF | 194 | 27.7 | 1.49 | 157 | 26.8% | 73.7% | 20.1% | -0.4 |
|
NYJ | 194 | 27.3 | 1.61 | 165 | 19.6% | 67.0% | 17.5% | 0.0 |
|
DAL | 209 | 28.4 | 1.63 | 158 | 19.6% | 67.5% | 11.5% | -0.2 |
|
BUF | 185 | 28.6 | 1.64 | 168 | 21.1% | 69.2% | 16.2% | -0.2 |
|
WAS | 197 | 26.4 | 1.68 | 140 | 27.9% | 68.5% | 22.8% | 0.1 |
|
NE | 193 | 28.6 | 1.68 | 168 | 20.7% | 68.9% | 13.5% | -0.1 |
|
DEN | 200 | 27.6 | 1.71 | 159 | 28.0% | 64.5% | 13.5% | 0.2 |
|
NO | 186 | 29.2 | 1.72 | 167 | 21.5% | 65.6% | 14.0% | 0.4 |
|
CIN | 188 | 30.4 | 1.75 | 155 | 21.3% | 64.4% | 8.5% | -0.4 |
|
BAL | 183 | 31.4 | 1.79 | 169 | 22.4% | 64.5% | 11.5% | 0.0 |
|
PHI | 181 | 27.8 | 1.80 | 165 | 21.5% | 67.4% | 16.6% | -0.5 |
|
TEN | 190 | 31.2 | 1.85 | 167 | 25.3% | 65.8% | 16.8% | -0.2 |
|
CAR | 194 | 30.2 | 1.90 | 167 | 21.1% | 65.5% | 15.5% | -0.5 |
|
TB | 209 | 28.3 | 1.92 | 163 | 28.7% | 66.0% | 17.2% | -0.5 |
|
HOU | 196 | 32.7 | 1.92 | 166 | 19.9% | 63.8% | 13.3% | -0.1 |
|
JAX | 195 | 32.0 | 1.95 | 169 | 21.0% | 63.6% | 16.4% | -0.4 |
|
PIT | 178 | 31.0 | 1.96 | 168 | 21.3% | 62.4% | 15.2% | -0.9 |
|
IND | 198 | 29.3 | 1.98 | 160 | 22.7% | 64.1% | 16.7% | 0.6 |
|
KC | 186 | 29.9 | 2.03 | 167 | 21.5% | 64.0% | 17.7% | 0.0 |
|
LAC | 201 | 31.3 | 2.03 | 159 | 19.9% | 62.7% | 14.9% | -0.1 |
|
MIA | 201 | 31.1 | 2.03 | 165 | 19.4% | 62.7% | 17.4% | 0.5 |
|
GB | 177 | 32.5 | 2.04 | 169 | 24.9% | 62.1% | 16.4% | -0.2 |
|
CLE | 187 | 30.6 | 2.05 | 156 | 22.5% | 61.5% | 17.6% | 0.4 |
|
NYG | 193 | 33.1 | 2.06 | 168 | 19.7% | 59.1% | 13.0% | -0.2 |
|
LAR | 174 | 33.0 | 2.07 | 179 | 21.8% | 58.6% | 14.4% | -0.4 |
|
MIN | 201 | 34.2 | 2.15 | 167 | 13.4% | 58.2% | 11.4% | -0.7 |
|
SEA | 198 | 33.6 | 2.15 | 172 | 18.2% | 60.6% | 15.2% | 0.0 |
|
LV | 180 | 34.4 | 2.22 | 171 | 17.2% | 59.4% | 13.9% | -0.1 |
|
ATL | 170 | 34.9 | 2.25 | 182 | 18.2% | 57.1% | 7.1% | -1.3 |
|
ARI | 192 | 30.5 | 2.28 | 162 | 22.4% | 58.9% | 16.7% | -0.4 |
|
DET | 178 | 37.2 | 2.31 | 173 | 17.4% | 59.0% | 10.1% | -0.3 |
|
CHI | 177 | 36.3 | 2.45 | 175 | 16.4% | 58.2% | 9.0% | 0.4 |
per Drive Results
Drives were analyzed more simply by their results. Their various outcomes are summarized on the following tables
for Teams' Offenses and Defenses. They are currently sorted by Punt rate, which is
bad for Offenses, and generally
good for Defenses.
The first two graphs show how Touchdown and Punt rates varied for the teams and their
EPA rankings.
*Note: Return TD column is total and not per drive. Kickoff return TDs
were not counted as drives, and punt return TDs were marked as drives resulting in a Punt, instead of an
Opp touchdown, and the returning team was also awarded a Return TD.*
2022 Team Offense, Drive Results good OK bad
| Team | Punt | Turnover | Field goal | Missed field goal | Touchdown | Return TD | End of half | Turnover on downs | Opp touchdown | Safety | |
|---|---|---|---|---|---|---|---|---|---|---|---|
|
DEN | 48.0% | 9.0% | 14.5% | 4.0% | 14.5% | 0 | 4.5% | 4.0% | 1.5% | 0.0% |
|
TEN | 46.9% | 9.4% | 10.4% | 2.1% | 17.2% | 0 | 8.3% | 4.7% | 1.0% | 0.0% |
|
HOU | 44.2% | 10.1% | 15.1% | 1.0% | 14.1% | 1 | 6.0% | 6.0% | 3.5% | 0.0% |
|
NYJ | 42.6% | 11.7% | 15.2% | 3.6% | 14.7% | 2 | 5.6% | 6.1% | 0.0% | 0.5% |
|
CAR | 42.4% | 8.9% | 17.8% | 1.0% | 17.3% | 0 | 6.3% | 5.2% | 1.0% | 0.0% |
|
WAS | 42.1% | 10.7% | 12.7% | 2.5% | 16.8% | 0 | 7.1% | 6.6% | 1.0% | 0.5% |
|
NE | 41.7% | 10.9% | 16.7% | 2.6% | 16.1% | 0 | 7.3% | 3.6% | 1.0% | 0.0% |
|
NO | 41.4% | 10.8% | 12.4% | 4.3% | 19.4% | 0 | 5.9% | 3.8% | 2.2% | 0.0% |
|
NYG | 41.0% | 6.9% | 16.0% | 1.6% | 22.3% | 0 | 6.9% | 4.8% | 0.0% | 0.5% |
|
TB | 40.8% | 10.2% | 15.0% | 3.4% | 16.5% | 0 | 7.8% | 6.3% | 0.0% | 0.0% |
|
LAR | 40.7% | 11.3% | 15.8% | 1.1% | 17.5% | 0 | 9.6% | 1.1% | 2.3% | 0.6% |
|
LAC | 38.4% | 8.9% | 16.7% | 1.5% | 21.7% | 0 | 5.4% | 6.9% | 0.5% | 0.0% |
|
PIT | 38.1% | 8.8% | 18.8% | 6.1% | 15.5% | 0 | 9.9% | 2.2% | 0.6% | 0.0% |
|
CHI | 36.8% | 11.5% | 13.7% | 1.1% | 20.3% | 0 | 6.0% | 8.8% | 1.6% | 0.0% |
|
ARI | 36.7% | 11.7% | 14.9% | 2.1% | 17.0% | 0 | 5.9% | 10.6% | 1.1% | 0.0% |
|
ATL | 36.7% | 11.2% | 18.9% | 3.0% | 20.1% | 1 | 5.9% | 4.1% | 0.0% | 0.0% |
|
MIN | 36.4% | 10.0% | 12.9% | 3.3% | 24.4% | 1 | 6.7% | 4.8% | 1.4% | 0.0% |
|
IND | 36.0% | 14.2% | 16.8% | 3.6% | 13.2% | 0 | 6.6% | 7.1% | 2.5% | 0.0% |
|
SEA | 35.7% | 10.6% | 17.6% | 1.5% | 23.1% | 0 | 6.5% | 3.5% | 1.0% | 0.5% |
|
DAL | 34.8% | 8.7% | 14.0% | 1.4% | 28.0% | 0 | 6.8% | 4.8% | 1.4% | 0.0% |
|
LV | 34.1% | 10.4% | 19.7% | 1.7% | 23.1% | 0 | 3.5% | 5.8% | 1.7% | 0.0% |
|
MIA | 33.8% | 10.8% | 14.9% | 3.1% | 23.1% | 0 | 6.2% | 6.2% | 1.0% | 1.0% |
|
CLE | 33.7% | 11.0% | 13.3% | 4.4% | 21.5% | 0 | 5.5% | 9.9% | 0.0% | 0.6% |
|
CIN | 33.5% | 8.6% | 13.5% | 2.7% | 27.6% | 0 | 8.6% | 4.3% | 1.1% | 0.0% |
|
JAX | 32.0% | 13.9% | 16.0% | 2.1% | 23.2% | 0 | 6.7% | 6.2% | 0.0% | 0.0% |
|
BAL | 31.7% | 11.1% | 20.1% | 3.2% | 18.5% | 1 | 8.5% | 5.8% | 1.1% | 0.0% |
|
SF | 31.6% | 8.2% | 15.8% | 2.0% | 27.6% | 0 | 8.2% | 4.6% | 1.0% | 1.0% |
|
PHI | 30.5% | 8.6% | 11.8% | 1.6% | 30.5% | 0 | 9.6% | 5.3% | 1.6% | 0.5% |
|
KC | 29.8% | 10.5% | 13.3% | 4.4% | 32.6% | 0 | 7.7% | 1.7% | 0.0% | 0.0% |
|
GB | 29.8% | 10.7% | 14.0% | 2.2% | 21.9% | 1 | 10.1% | 10.1% | 1.1% | 0.0% |
|
DET | 29.4% | 6.8% | 13.6% | 3.4% | 29.4% | 0 | 6.2% | 9.0% | 1.7% | 0.6% |
|
BUF | 26.5% | 14.3% | 15.9% | 2.1% | 29.1% | 2 | 7.4% | 3.2% | 1.1% | 0.5% |
2022 Team Defense, Drive Results good OK bad
| Team | Punt | Turnover | Field goal | Missed field goal | Touchdown | Return TD | End of half | Turnover on downs | Opp touchdown | Safety | |
|---|---|---|---|---|---|---|---|---|---|---|---|
|
TEN | 44.2% | 10.0% | 13.7% | 1.1% | 20.5% | 0 | 6.8% | 3.2% | 0.5% | 0.0% |
|
WAS | 44.2% | 6.1% | 13.2% | 1.5% | 18.3% | 0 | 8.1% | 6.6% | 1.5% | 0.5% |
|
TB | 44.0% | 9.1% | 11.5% | 1.4% | 22.5% | 0 | 6.2% | 4.8% | 0.5% | 0.0% |
|
NO | 43.0% | 6.5% | 17.2% | 1.6% | 17.2% | 0 | 8.6% | 5.4% | 0.5% | 0.0% |
|
DEN | 43.0% | 10.5% | 19.5% | 1.0% | 16.0% | 0 | 6.5% | 3.0% | 0.0% | 0.5% |
|
SF | 40.7% | 13.9% | 8.8% | 2.6% | 17.5% | 0 | 7.7% | 7.2% | 1.5% | 0.0% |
|
PHI | 40.3% | 13.8% | 12.2% | 1.7% | 20.4% | 0 | 5.5% | 5.0% | 1.1% | 0.0% |
|
CAR | 40.2% | 6.7% | 12.9% | 4.6% | 21.6% | 0 | 7.2% | 5.2% | 1.5% | 0.0% |
|
BAL | 38.8% | 13.7% | 17.5% | 3.8% | 18.0% | 0 | 3.8% | 4.4% | 0.0% | 0.0% |
|
NYJ | 38.7% | 8.2% | 17.5% | 5.2% | 15.5% | 2 | 5.7% | 7.7% | 0.5% | 1.0% |
|
PIT | 38.2% | 12.4% | 16.9% | 2.2% | 20.8% | 0 | 5.1% | 3.9% | 0.6% | 0.0% |
|
IND | 37.9% | 9.1% | 13.1% | 1.0% | 22.7% | 0 | 8.6% | 6.1% | 1.5% | 0.0% |
|
HOU | 37.2% | 11.2% | 15.3% | 2.0% | 20.9% | 1 | 8.2% | 4.1% | 0.5% | 0.5% |
|
KC | 37.1% | 9.7% | 12.4% | 0.5% | 23.7% | 0 | 7.5% | 7.5% | 1.1% | 0.5% |
|
ARI | 37.0% | 7.8% | 15.1% | 1.0% | 26.0% | 0 | 6.8% | 3.6% | 2.6% | 0.0% |
|
NE | 36.8% | 10.4% | 12.4% | 2.6% | 18.7% | 3 | 7.3% | 8.3% | 3.6% | 0.0% |
|
NYG | 36.8% | 7.3% | 20.2% | 3.1% | 20.7% | 0 | 7.3% | 3.6% | 1.0% | 0.0% |
|
BUF | 36.8% | 14.1% | 13.0% | 4.3% | 17.8% | 0 | 4.9% | 7.6% | 0.5% | 1.1% |
|
DAL | 36.4% | 14.4% | 16.3% | 2.9% | 16.3% | 0 | 6.7% | 5.7% | 1.4% | 0.0% |
|
CIN | 35.6% | 12.8% | 18.6% | 3.2% | 17.0% | 0 | 4.8% | 6.9% | 1.1% | 0.0% |
|
MIA | 35.3% | 7.0% | 14.4% | 1.0% | 22.9% | 1 | 9.0% | 8.0% | 2.0% | 0.5% |
|
LAC | 34.3% | 11.9% | 14.4% | 3.5% | 22.9% | 0 | 8.5% | 3.5% | 0.5% | 0.5% |
|
CLE | 34.2% | 8.6% | 16.0% | 2.7% | 22.5% | 0 | 9.1% | 5.3% | 1.6% | 0.0% |
|
LAR | 33.9% | 11.5% | 20.7% | 2.3% | 20.7% | 0 | 6.9% | 3.4% | 0.6% | 0.0% |
|
GB | 33.9% | 12.4% | 15.3% | 4.0% | 22.6% | 0 | 6.2% | 4.0% | 1.1% | 0.6% |
|
JAX | 33.8% | 11.8% | 14.9% | 1.0% | 21.5% | 0 | 6.2% | 8.7% | 2.1% | 0.0% |
|
SEA | 31.8% | 11.1% | 15.2% | 2.5% | 24.2% | 0 | 7.6% | 6.6% | 1.0% | 0.0% |
|
ATL | 31.8% | 9.4% | 18.8% | 2.9% | 24.1% | 0 | 5.9% | 4.7% | 1.8% | 0.6% |
|
DET | 31.5% | 11.2% | 14.0% | 2.8% | 27.0% | 0 | 6.7% | 5.6% | 0.6% | 0.6% |
|
LV | 31.1% | 5.6% | 15.6% | 6.7% | 25.0% | 0 | 9.4% | 5.0% | 1.7% | 0.0% |
|
MIN | 30.8% | 10.9% | 19.4% | 3.0% | 22.4% | 1 | 5.5% | 7.5% | 0.5% | 0.0% |
|
CHI | 28.8% | 11.9% | 11.9% | 4.5% | 29.9% | 1 | 8.5% | 4.5% | 0.0% | 0.0% |
Offensive Drive Punt Rate, TD Rate vs EPA Rank (1/9)
TD, punt rates of offenses organized by EPA ranking

Defensive Drive Punt Rate, TD Rate vs EPA Rank (2/9)
TD, punt rates of defenses organized by EPA ranking

Drives Resulting in Opponent Touchdowns - Off vs Def (3/9)
very good for team on Defense (right),
very bad for team on Offense (up)

Offensive Drives Resulting in Field Goals vs Missed Field Goals (4/9)
AKA evaluating kickers for fantasy

Defensive Drives Resulting in Punts vs Turnovers (5/9) Raiders . . . 😧

Offensive Drives Resulting in Punts vs Turnovers (6/9) Lions . . . 😲

Defensive Drives Resulting in Touchdowns vs Field goals (7/9) 49ers were good

Offensive Drives Resulting in Touchdowns vs Field goals (8/9) Titans were bad

Offensive Drives - Points vs Touchdown Rate (9/9)
obvious correlation showing importance of TDs

Penalties
Committed penalties were tallied for Teams' Offense, Defense, and Special Teams. Total EPA sacrificed to penalties was
calculated for each phase, and total penalty yards were added for Offense and Defense. The table is currently sorted by
Def_penalty_EPA_given, which is how much EPA a team's defense gave to their opponents on offense. Low numbers show more
disciplined / lucky / sneaky teams.
*I did not clean this data thoroughly, declined penalties
and other discrepancies likely contribute to penalty metrics.
2022 Team Penalties good OK bad
| Team | Off_penalty | Off_penalty_EPA_lost | Off_penalty_yd_lost | Def_penalty | Def_penalty_EPA_given | Def_penalty_yd_given | ST_penalty | ST_penalty_EPA | |
|---|---|---|---|---|---|---|---|---|---|
|
ATL | 47 | 42.0 | 396 | 21 | 26.1 | 198 | 9 | 8.1 |
|
MIN | 54 | 39.0 | 369 | 37 | 31.3 | 327 | 11 | 6.7 |
|
LAR | 42 | 36.2 | 313 | 34 | 32.8 | 342 | 11 | 7.0 |
|
JAX | 51 | 40.6 | 356 | 42 | 33.9 | 348 | 9 | 3.8 |
|
PIT | 55 | 41.4 | 384 | 39 | 35.7 | 327 | 13 | 14.8 |
|
LAC | 53 | 40.1 | 377 | 35 | 38.0 | 300 | 5 | 3.7 |
|
ARI | 74 | 66.8 | 527 | 43 | 38.6 | 374 | 14 | 11.7 |
|
CIN | 50 | 45.0 | 370 | 38 | 39.6 | 295 | 14 | 9.2 |
|
HOU | 41 | 32.2 | 299 | 47 | 39.7 | 345 | 7 | 5.0 |
|
SEA | 72 | 64.8 | 560 | 39 | 40.0 | 324 | 7 | 3.4 |
|
CHI | 49 | 38.7 | 361 | 31 | 40.0 | 393 | 3 | 2.6 |
|
TB | 64 | 52.6 | 470 | 38 | 43.0 | 357 | 1 | 1.3 |
|
GB | 48 | 38.3 | 381 | 41 | 43.3 | 366 | 13 | 9.9 |
|
BUF | 45 | 44.3 | 347 | 49 | 43.5 | 375 | 5 | 2.2 |
|
LV | 72 | 59.6 | 569 | 41 | 43.9 | 363 | 13 | 6.1 |
|
PHI | 56 | 43.1 | 387 | 34 | 44.2 | 295 | 5 | 4.1 |
|
BAL | 47 | 34.6 | 342 | 39 | 47.9 | 372 | 5 | 2.5 |
|
NYJ | 60 | 51.5 | 469 | 31 | 48.2 | 397 | 8 | 8.1 |
|
NE | 62 | 59.9 | 457 | 42 | 48.9 | 384 | 8 | 5.2 |
|
DET | 47 | 33.1 | 394 | 43 | 49.7 | 379 | 3 | 2.3 |
|
IND | 49 | 37.9 | 355 | 40 | 50.6 | 439 | 5 | 3.2 |
|
NYG | 64 | 52.9 | 455 | 47 | 51.4 | 417 | 9 | 7.4 |
|
CAR | 60 | 39.7 | 427 | 44 | 51.9 | 435 | 15 | 9.7 |
|
TEN | 67 | 50.9 | 513 | 44 | 52.1 | 443 | 11 | 7.2 |
|
WAS | 52 | 41.2 | 363 | 40 | 54.0 | 442 | 12 | 12.0 |
|
KC | 42 | 33.1 | 349 | 45 | 55.1 | 489 | 13 | 10.2 |
|
SF | 56 | 47.3 | 398 | 41 | 57.6 | 360 | 8 | 10.8 |
|
DAL | 53 | 43.9 | 410 | 53 | 57.7 | 447 | 13 | 11.3 |
|
MIA | 63 | 49.1 | 424 | 55 | 58.5 | 491 | 7 | 4.3 |
|
DEN | 55 | 43.0 | 408 | 58 | 62.4 | 562 | 8 | 5.2 |
|
CLE | 57 | 47.3 | 419 | 45 | 62.5 | 446 | 6 | 6.4 |
|
NO | 52 | 41.8 | 350 | 47 | 65.4 | 491 | 8 | 5.6 |
Penalty EPA - Defense vs Offense (1/5)

Penalties on Offense (2/5)

Penalty Yards Lost on Offense (3/5)

Penalties on Defense (4/5)

Penalty Yards Given on Defense (5/5)
 ">
">
Oilers/Titans Careers by AV
Pro-Football-Reference Oilers/Titans career AV table
Titans Era Group: Player careers starting with or ending after the move from Houston to Tennessee.
Players removed with less than 6 games played
Top 500 Group: Top 500 entries on table (total AV) - analysis not presented, see graphs
Graphs only show players starting during or ending after the '90s.
Pro-Football-Reference provides an "Approximate Value" metric.
It is a measure of seasonal value for any player at any position, and assigned each year.
They conveniently provide tables of top Approximate Value (AV) earners for each franchise.
I used the Oilers/Titans table, and considered AV normalized by games played.
Processing Details:
- Titans Era - players with Titan's careers starting after 1995, or ending after 1996.
- Games Played - players with 5 or less games were removed
- AV per Game Played - AV was divided by Games, then multiplied by 1,000 for aesthetics
- Positional Grouping - the wide variety of positions listed were grouped, original listings are preserved on the table. All positions in the grouping are listed on the top of the graphs
- Position Group Cleaning - individual players were checked. For example, "DB" was about an even split of Safeties and Cornerbacks. I tried and am open to feedback
- Overall Rank - indicates position on the original career rank table, ordered by total AV with franchise
I ordered the data by AV per Game Played (AV/G) for each position grouping, and also plotted AV against Games.
The top 5 players for AV, Games, and AV/G were labelled on the graphs.
The graphs highlight Titans legends, players with short stints of greatness, and long-time role players.
Players that are above the TAN regression line have relatively high AV/G, which is also shown in their
marker's shading, darker is higher AV/G. Marker size was also scaled with Games played, though not as distinctly.
Position Groups:
Position Grouping: OL
| Overall Rank | Player | PFR position | From | To | Games | AV | AV per game | |
|---|---|---|---|---|---|---|---|---|
| 1 | Bruce Matthews | LG | 1983 | 2001 | 296 | 215 | 726 | |
| 90 | Mark Stepnoski | C | 1995 | 1998 | 61 | 37 | 607 | |
| 107 | Jack Conklin | OT | 2016 | 2019 | 57 | 34 | 596 | |
| 144 | Rodger Saffold | LT | 2019 | 2021 | 46 | 27 | 587 | |
| 112 | Kevin Mawae | C | 2006 | 2009 | 61 | 34 | 557 | |
| 16 | Michael Roos | LT | 2005 | 2014 | 148 | 77 | 520 | |
| 44 | Taylor Lewan | OT | 2014 | 2022 | 105 | 54 | 514 | |
| 72 | Fred Miller | RT | 2000 | 2004 | 80 | 41 | 512 | |
| 651 | Robert Turner | G | 2013 | 2013 | 6 | 3 | 500 | |
| 7 | Brad Hopkins | LT | 1993 | 2005 | 194 | 96 | 495 | |
| 37 | David Stewart | RT | 2006 | 2013 | 116 | 57 | 491 | |
| 137 | Jon Runyan | RT | 1996 | 1999 | 58 | 28 | 483 | |
| 186 | Josh Kline | OL | 2016 | 2018 | 46 | 22 | 478 | |
| 340 | Gennaro DiNapoli | C | 2001 | 2002 | 21 | 10 | 476 | |
| 179 | Quinton Spain | OG | 2015 | 2018 | 50 | 23 | 460 | |
| 178 | Justin Hartwig | C | 2002 | 2005 | 50 | 23 | 460 | |
| 133 | Jake Scott | RG | 2008 | 2011 | 64 | 29 | 453 | |
| 24 | Benji Olson | RG | 1998 | 2007 | 152 | 67 | 441 | |
| 55 | Ben Jones | C | 2016 | 2022 | 107 | 47 | 439 | |
| 395 | Byron Bell | RT | 2015 | 2015 | 16 | 7 | 438 | |
| 197 | Chance Warmack | OG | 2013 | 2016 | 48 | 21 | 438 | |
| 278 | Andy Levitre | LG | 2013 | 2014 | 32 | 14 | 438 | |
| 484 | Steve Hutchinson | LG | 2012 | 2012 | 12 | 5 | 417 | |
| 291 | David Quessenberry | OT | 2019 | 2021 | 33 | 13 | 394 | |
| 192 | Jacob Bell | LG | 2004 | 2007 | 55 | 21 | 382 | |
| 615 | Joe Looney | G | 2015 | 2015 | 8 | 3 | 375 | |
| 617 | Deuce Lutui | RG | 2012 | 2012 | 8 | 3 | 375 | |
| 198 | Nate Davis | OL | 2019 | 2022 | 54 | 20 | 370 | |
| 554 | Michael Oher | RT | 2014 | 2014 | 11 | 4 | 364 | |
| 503 | Ty Sambrailo | OT | 2020 | 2021 | 14 | 5 | 357 | |
| 124 | Zach Piller | G | 1999 | 2006 | 87 | 31 | 356 | |
| 536 | Andy Gallik | C | 2015 | 2015 | 12 | 4 | 333 | |
| 185 | Dennis Kelly | OT | 2016 | 2020 | 74 | 22 | 297 | |
| 103 | Eugene Amano | C | 2004 | 2011 | 124 | 34 | 274 | |
| 634 | Jeremiah Poutasi | OT | 2015 | 2015 | 11 | 3 | 273 | |
| 231 | Kevin Long | C | 1998 | 2001 | 63 | 17 | 270 | |
| 200 | Leroy Harris | C | 2007 | 2012 | 75 | 20 | 267 | |
| 268 | Brian Schwenke | C | 2013 | 2017 | 57 | 15 | 263 | |
| 334 | Fernando Velasco | G | 2009 | 2012 | 49 | 11 | 224 | |
| 568 | Byron Stingily | T | 2012 | 2014 | 20 | 4 | 200 | |
| 625 | Jamon Meredith | T | 2014 | 2015 | 16 | 3 | 188 | |
| 423 | Scott Sanderson | T | 1997 | 2000 | 38 | 7 | 184 | |
| 326 | Jason Layman | G | 1996 | 1999 | 61 | 11 | 180 | |
| 621 | Kevin Matthews | C | 2010 | 2012 | 17 | 3 | 176 | |
| 891 | Tyler Marz | T | 2018 | 2018 | 6 | 1 | 167 | |
| 506 | Chris Spencer | C | 2013 | 2014 | 32 | 5 | 156 | |
| 514 | Tom Ackerman | G | 2002 | 2003 | 27 | 4 | 148 | |
| 530 | Jamil Douglas | OG | 2019 | 2020 | 29 | 4 | 138 | |
| 228 | Ken Amato | C | 2003 | 2011 | 125 | 17 | 136 | |
| 469 | Aaron Brewer | C | 2020 | 2022 | 37 | 5 | 135 | |
| 386 | Michael Otto | T | 2008 | 2013 | 62 | 8 | 129 | |
| 328 | Jason Mathews | T | 1998 | 2004 | 86 | 11 | 128 | |
| 694 | Aaron Graham | C | 2002 | 2002 | 16 | 2 | 125 | |
| 307 | Erik Norgard | G | 1990 | 1998 | 108 | 12 | 111 | |
| 826 | Jon Dorenbos | C | 2005 | 2006 | 10 | 1 | 100 | |
| 883 | Kendall Lamm | T | 2021 | 2021 | 12 | 1 | 83 | |
| 616 | Daniel Loper | T | 2006 | 2008 | 40 | 3 | 75 | |
| 614 | Corey Levin | OL | 2018 | 2022 | 41 | 3 | 73 | |
| 922 | Dillon Radunz | OL | 2021 | 2022 | 22 | 1 | 45 |

- Notes:
- Bruce Matthews had an awesome career
- Taylor Lewan not labelled, he is right beside David Stewart
- Lewan and Ben Jones are only current Titans with over 100 games played
- Titans enjoyed some long, productive OL careers early on
Position Grouping: QB
| Overall Rank | Player | PFR position | From | To | Games | AV | AV per game | |
|---|---|---|---|---|---|---|---|---|
| 4 | Steve McNair | QB | 1995 | 2005 | 139 | 114 | 820 | |
| 354 | Ryan Fitzpatrick | QB | 2013 | 2013 | 11 | 9 | 818 | |
| 53 | Marcus Mariota | QB | 2015 | 2019 | 63 | 48 | 762 | |
| 78 | Ryan Tannehill | QB | 2019 | 2022 | 56 | 40 | 714 | |
| 118 | Vince Young | QB | 2006 | 2010 | 54 | 33 | 611 | |
| 251 | Jake Locker | QB | 2011 | 2014 | 30 | 16 | 533 | |
| 300 | Matt Hasselbeck | QB | 2011 | 2012 | 24 | 12 | 500 | |
| 578 | Charlie Whitehurst | QB | 2014 | 2015 | 8 | 4 | 500 | |
| 335 | Billy Volek | QB | 2001 | 2005 | 24 | 11 | 458 | |
| 208 | Kerry Collins | QB | 2006 | 2010 | 43 | 19 | 442 | |
| 346 | Neil O'Donnell | QB | 1999 | 2003 | 25 | 10 | 400 | |
| 689 | Blaine Gabbert | QB | 2018 | 2018 | 8 | 2 | 250 | |
| 804 | Matt Cassel | QB | 2016 | 2017 | 6 | 1 | 167 | |
| 881 | Dave Krieg | QB | 1997 | 1998 | 13 | 1 | 77 | |
| 900 | Zach Mettenberger | QB | 2014 | 2015 | 14 | 1 | 71 |

- Notes:
- RIP Steve McNair
- Interesting that Tannehill and Mariota show similar rate to McNair (and Moon).
- Titans legend, Ryan Fitzpatrick!
Position Grouping: RB
| Overall Rank | Player | PFR position | From | To | Games | AV | AV per game | |
|---|---|---|---|---|---|---|---|---|
| 23 | Chris Johnson | RB | 2008 | 2013 | 95 | 68 | 716 | |
| 10 | Eddie George | RB | 1996 | 2003 | 128 | 87 | 680 | |
| 210 | DeMarco Murray | RB | 2016 | 2017 | 31 | 19 | 613 | |
| 45 | Derrick Henry | RB | 2016 | 2022 | 99 | 53 | 535 | |
| 301 | Travis Henry | RB | 2005 | 2006 | 24 | 12 | 500 | |
| 165 | Chris Brown | RB | 2003 | 2007 | 54 | 24 | 444 | |
| 438 | D'Onta Foreman | RB | 2020 | 2021 | 15 | 6 | 400 | |
| 505 | Antowain Smith | RB | 2004 | 2004 | 13 | 5 | 385 | |
| 360 | Dion Lewis | RB | 2018 | 2019 | 32 | 9 | 281 | |
| 272 | LenDale White | RB | 2006 | 2009 | 58 | 15 | 259 | |
| 705 | Skip Hicks | RB | 2001 | 2001 | 9 | 2 | 222 | |
| 454 | Bishop Sankey | RB | 2014 | 2015 | 29 | 6 | 207 | |
| 237 | Rodney Thomas | RB | 1995 | 2000 | 91 | 17 | 187 | |
| 413 | Robert Holcombe | RB | 2002 | 2004 | 39 | 7 | 179 | |
| 832 | Darrynton Evans | RB | 2020 | 2021 | 6 | 1 | 167 | |
| 496 | Jeremy McNichols | RB | 2020 | 2021 | 30 | 5 | 167 | |
| 540 | Shonn Greene | RB | 2013 | 2014 | 24 | 4 | 167 | |
| 763 | John Simon | RB | 2002 | 2002 | 12 | 2 | 167 | |
| 603 | Dontrell Hilliard | RB | 2021 | 2022 | 20 | 3 | 150 | |
| 807 | David Cobb | RB | 2015 | 2015 | 7 | 1 | 143 | |
| 501 | Javon Ringer | RB | 2009 | 2012 | 37 | 5 | 135 | |
| 517 | Antonio Andrews | RB | 2014 | 2016 | 34 | 4 | 118 | |
| 595 | Troy Fleming | RB | 2004 | 2005 | 29 | 3 | 103 | |
| 857 | Chris Henry | RB | 2007 | 2009 | 10 | 1 | 100 | |
| 809 | Greg Comella | FB | 2002 | 2002 | 12 | 1 | 83 | |
| 916 | Jarrett Payton | RB | 2005 | 2005 | 13 | 1 | 77 | |
| 695 | Mike Green | RB | 2000 | 2002 | 32 | 2 | 62 | |
| 482 | Ahmard Hall | FB | 2006 | 2011 | 85 | 5 | 59 | |
| 841 | Quinton Ganther | RB | 2006 | 2008 | 17 | 1 | 59 | |
| 959 | Leon Washington | RB | 2013 | 2014 | 21 | 1 | 48 | |
| 851 | Jamie Harper | RB | 2011 | 2012 | 23 | 1 | 43 | |
| 794 | Jackie Battle | RB | 2013 | 2014 | 32 | 1 | 31 |

- Notes:
- Titans have had some elite RBs
- CJ2K and Eddie George are legends
- Henry has lower AV per game due to low usage in his early years
- DeMarco Murray was most of the Titans offense for a time
Position Grouping: DE
| Overall Rank | Player | PFR position | From | To | Games | AV | AV per game | |
|---|---|---|---|---|---|---|---|---|
| 33 | Jevon Kearse | LDE | 1999 | 2009 | 88 | 60 | 682 | |
| 338 | Jason Babin | LB | 2010 | 2010 | 16 | 10 | 625 | |
| 11 | Jurrell Casey | DE | 2011 | 2019 | 139 | 86 | 619 | |
| 74 | Kyle Vanden Bosch | RDE | 2005 | 2009 | 74 | 41 | 554 | |
| 123 | Brian Orakpo | LLB | 2015 | 2018 | 61 | 31 | 508 | |
| 119 | Kevin Carter | LDE | 2001 | 2004 | 64 | 32 | 500 | |
| 127 | Harold Landry | OLB | 2018 | 2021 | 64 | 30 | 469 | |
| 130 | Tony Brown | DE | 2006 | 2010 | 69 | 29 | 420 | |
| 57 | Derrick Morgan | DE | 2010 | 2018 | 118 | 47 | 398 | |
| 183 | Kenny Holmes | RDE | 1997 | 2000 | 58 | 22 | 379 | |
| 587 | Jadeveon Clowney | DE | 2020 | 2020 | 8 | 3 | 375 | |
| 217 | Zach Brown | OLB | 2012 | 2015 | 49 | 18 | 367 | |
| 246 | Carlos Hall | RDE | 2002 | 2004 | 45 | 16 | 356 | |
| 219 | Anthony Cook | LDE | 1995 | 1998 | 51 | 18 | 353 | |
| 332 | Ropati Pitoitua | DE | 2013 | 2015 | 33 | 11 | 333 | |
| 232 | Antwan Odom | RDE | 2004 | 2007 | 52 | 17 | 327 | |
| 249 | Jason Jones | DE | 2008 | 2011 | 49 | 16 | 327 | |
| 309 | James Roberson | RDE | 1996 | 1998 | 40 | 12 | 300 | |
| 257 | Dave Ball | DE | 2008 | 2011 | 51 | 15 | 294 | |
| 597 | Reggie Gilbert | LB | 2019 | 2019 | 11 | 3 | 273 | |
| 234 | Robaire Smith | RDE | 2000 | 2006 | 64 | 17 | 266 | |
| 383 | Pratt Lyons | DE | 1997 | 1998 | 32 | 8 | 250 | |
| 525 | Jack Crawford | DE | 2020 | 2020 | 16 | 4 | 250 | |
| 411 | Jovan Haye | DE | 2009 | 2010 | 29 | 7 | 241 | |
| 427 | Denico Autry | DE | 2021 | 2022 | 27 | 6 | 222 | |
| 304 | Travis LaBoy | DE | 2004 | 2007 | 54 | 12 | 222 | |
| 400 | Kamalei Correa | OLB | 2018 | 2020 | 32 | 7 | 219 | |
| 341 | William Hayes | DE | 2008 | 2011 | 48 | 10 | 208 | |
| 720 | Mike Jones | DE | 1999 | 1999 | 11 | 2 | 182 | |
| 467 | David Bass | DE | 2015 | 2016 | 29 | 5 | 172 | |
| 533 | Sharif Finch | LB | 2018 | 2021 | 24 | 4 | 167 | |
| 827 | Marques Douglas | DE | 2010 | 2010 | 6 | 1 | 167 | |
| 786 | Kevin Aldridge | DE | 2002 | 2002 | 6 | 1 | 167 | |
| 761 | Bo Schobel | DE | 2004 | 2005 | 13 | 2 | 154 | |
| 592 | Bud Dupree | DE | 2021 | 2022 | 20 | 3 | 150 | |
| 679 | Keith Embray | DE | 2000 | 2000 | 14 | 2 | 143 | |
| 879 | David King | DE | 2017 | 2017 | 7 | 1 | 143 | |
| 830 | Lavar Edwards | DE | 2013 | 2013 | 7 | 1 | 143 | |
| 969 | Jarius Wynn | DE | 2012 | 2012 | 7 | 1 | 143 | |
| 266 | Karl Klug | DL | 2011 | 2017 | 109 | 15 | 138 | |
| 777 | Erik Walden | ROLB | 2017 | 2017 | 16 | 2 | 125 | |
| 696 | Quentin Groves | DE | 2014 | 2014 | 16 | 2 | 125 | |
| 756 | Derick Roberson | DE | 2019 | 2021 | 16 | 2 | 125 | |
| 837 | Bryce Fisher | DE | 2007 | 2007 | 9 | 1 | 111 | |
| 676 | Kevin Dodd | DE | 2016 | 2017 | 18 | 2 | 111 | |
| 954 | Cameron Wake | LB | 2019 | 2019 | 9 | 1 | 111 | |
| 556 | Juqua Parker | DE | 2001 | 2004 | 41 | 4 | 98 | |
| 811 | Sean Conover | DE | 2006 | 2007 | 11 | 1 | 91 | |
| 920 | Shaun Phillips | LOLB | 2014 | 2014 | 11 | 1 | 91 | |
| 839 | Mike Frederick | DE | 1999 | 1999 | 13 | 1 | 77 | |
| 942 | Scott Solomon | DE | 2012 | 2012 | 13 | 1 | 77 | |
| 823 | Matt Dickerson | DE | 2018 | 2020 | 18 | 1 | 56 | |
| 784 | Olasunkanmi Adeniyi | DE | 2021 | 2022 | 19 | 1 | 53 | |
| 943 | Justin Staples | DL | 2014 | 2016 | 21 | 1 | 48 |

- Notes:
- Exterior DL / EDGE, with a number of names moved from LB
- Jurrell Casey was so good for so long! If only Titans were better for more of those years
- Harold Landry narrowly missed labelling, he is by Carter/Orakpo
Position Grouping: LB
| Overall Rank | Player | PFR position | From | To | Games | AV | AV per game | |
|---|---|---|---|---|---|---|---|---|
| 132 | Randall Godfrey | MLB | 2000 | 2002 | 38 | 29 | 763 | |
| 502 | Barrett Ruud | MLB | 2011 | 2011 | 9 | 5 | 556 | |
| 12 | Keith Bulluck | RLB | 2000 | 2009 | 157 | 85 | 541 | |
| 437 | Moise Fokou | MLB | 2013 | 2013 | 12 | 6 | 500 | |
| 31 | Eddie Robinson | LLB | 1992 | 2001 | 127 | 62 | 488 | |
| 141 | Rashaan Evans | ILB | 2018 | 2021 | 59 | 27 | 458 | |
| 154 | David Thornton | LLB | 2006 | 2009 | 58 | 26 | 448 | |
| 135 | Avery Williamson | ILB | 2014 | 2021 | 65 | 29 | 446 | |
| 289 | Lonnie Marts | LLB | 1997 | 1998 | 30 | 13 | 433 | |
| 86 | Wesley Woodyard | MLB | 2014 | 2019 | 93 | 38 | 409 | |
| 206 | Akeem Ayers | MLB | 2011 | 2014 | 50 | 19 | 380 | |
| 157 | Jayon Brown | ILB | 2017 | 2021 | 66 | 25 | 379 | |
| 239 | Will Witherspoon | RLB | 2010 | 2012 | 46 | 17 | 370 | |
| 60 | Joe Bowden | LLB | 1992 | 1999 | 123 | 44 | 358 | |
| 245 | Greg Favors | LB | 1999 | 2001 | 47 | 16 | 340 | |
| 145 | Peter Sirmon | LLB | 2000 | 2006 | 81 | 27 | 333 | |
| 160 | Stephen Tulloch | MLB | 2006 | 2010 | 80 | 25 | 312 | |
| 329 | Colin McCarthy | MLB | 2011 | 2013 | 36 | 11 | 306 | |
| 355 | Ryan Fowler | MLB | 2007 | 2008 | 30 | 9 | 300 | |
| 373 | Rocky Calmus | MLB | 2002 | 2004 | 27 | 8 | 296 | |
| 149 | Barron Wortham | MLB | 1994 | 1999 | 92 | 27 | 293 | |
| 250 | Brad Kassell | MLB | 2002 | 2005 | 56 | 16 | 286 | |
| 566 | Sean Spence | LILB | 2016 | 2016 | 15 | 4 | 267 | |
| 313 | Kamerion Wimbley | ROLB | 2012 | 2014 | 45 | 12 | 267 | |
| 673 | Zach Cunningham | OLB | 2021 | 2022 | 9 | 2 | 222 | |
| 361 | David Long | LB | 2019 | 2022 | 50 | 9 | 180 | |
| 419 | Gerald McRath | LLB | 2009 | 2011 | 40 | 7 | 175 | |
| 403 | Jacob Ford | LB | 2008 | 2010 | 43 | 7 | 163 | |
| 369 | Rocky Boiman | ROLB | 2002 | 2005 | 54 | 8 | 148 | |
| 781 | LeVar Woods | MLB | 2006 | 2007 | 15 | 2 | 133 | |
| 824 | Zach Diles | MLB | 2012 | 2013 | 8 | 1 | 125 | |
| 770 | Josh Stamer | LB | 2008 | 2008 | 16 | 2 | 125 | |
| 680 | Justin Ena | LB | 2004 | 2004 | 16 | 2 | 125 | |
| 671 | Doug Colman | MLB | 1999 | 1999 | 16 | 2 | 125 | |
| 966 | Jamie Winborn | RILB | 2009 | 2010 | 8 | 1 | 125 | |
| 598 | Zaviar Gooden | OLB | 2013 | 2014 | 24 | 3 | 125 | |
| 588 | William Compton | MLB | 2018 | 2020 | 24 | 3 | 125 | |
| 473 | Frank Chamberlin | MLB | 2000 | 2002 | 43 | 5 | 116 | |
| 933 | Rich Scanlon | LB | 2007 | 2007 | 9 | 1 | 111 | |
| 815 | Rennie Curran | LB | 2010 | 2010 | 9 | 1 | 111 | |
| 803 | Jeremy Cain | LB | 2007 | 2007 | 9 | 1 | 111 | |
| 754 | Monty Rice | LB | 2021 | 2022 | 19 | 2 | 105 | |
| 504 | Tim Shaw | MLB | 2010 | 2012 | 48 | 5 | 104 | |
| 416 | Terry Killens | LOLB | 1996 | 2000 | 78 | 7 | 90 | |
| 767 | Cody Spencer | LB | 2004 | 2005 | 23 | 2 | 87 | |
| 607 | Lenoy Jones | MLB | 1996 | 1998 | 36 | 3 | 83 | |
| 746 | Nate Palmer | ROLB | 2016 | 2017 | 24 | 2 | 83 | |
| 723 | Stanford Keglar | LB | 2008 | 2009 | 25 | 2 | 80 | |
| 842 | Gilbert Gardner | LB | 2007 | 2007 | 13 | 1 | 77 | |
| 956 | Aaron Wallace | OLB | 2016 | 2018 | 13 | 1 | 77 | |
| 769 | Dennis Stallings | LB | 1997 | 1998 | 28 | 2 | 71 | |
| 519 | Patrick Bailey | LB | 2010 | 2013 | 56 | 4 | 71 | |
| 520 | Daren Bates | LB | 2017 | 2020 | 58 | 4 | 69 | |
| 660 | Colin Allred | LB | 2007 | 2010 | 32 | 2 | 62 | |
| 798 | Colby Bockwoldt | RLB | 2006 | 2006 | 16 | 1 | 62 | |
| 868 | Steven Johnson | MLB | 2015 | 2015 | 16 | 1 | 62 | |
| 962 | Ray Wells | LB | 2003 | 2003 | 16 | 1 | 62 | |
| 753 | Robert Reynolds | LB | 2004 | 2006 | 33 | 2 | 61 | |
| 678 | Nick Dzubnar | LB | 2020 | 2021 | 33 | 2 | 61 | |
| 871 | Joseph Jones | OLB | 2021 | 2022 | 20 | 1 | 50 | |
| 808 | Dylan Cole | LB | 2021 | 2022 | 22 | 1 | 45 |

- Notes:
- Mr.Monday Night!
- Godfrey was really good in the early NFL 2K games
- Jayon Brown is to right of Evans/Thornton, within shaeded area
- Not a lot of recent LBs with long careers here
Position Grouping: S
| Overall Rank | Player | PFR position | From | To | Games | AV | AV per game | |
|---|---|---|---|---|---|---|---|---|
| 29 | Blaine Bishop | SS | 1993 | 2001 | 126 | 62 | 492 | |
| 27 | Marcus Robertson | FS | 1991 | 2000 | 135 | 63 | 467 | |
| 47 | Kevin Byard | S | 2016 | 2022 | 110 | 50 | 455 | |
| 26 | Michael Griffin | FS | 2007 | 2015 | 141 | 63 | 447 | |
| 98 | Chris Hope | SS | 2006 | 2011 | 85 | 35 | 412 | |
| 528 | Johnathan Cyprien | SS | 2017 | 2017 | 10 | 4 | 400 | |
| 280 | Lance Schulters | DB | 2002 | 2004 | 35 | 14 | 400 | |
| 255 | Kenny Vaccaro | FS | 2018 | 2020 | 42 | 16 | 381 | |
| 388 | Bernard Pollard | SS | 2013 | 2014 | 21 | 8 | 381 | |
| 205 | Tank Williams | SS | 2002 | 2005 | 57 | 20 | 351 | |
| 315 | Jordan Babineaux | DB | 2011 | 2012 | 32 | 11 | 344 | |
| 293 | Da'Norris Searcy | DB | 2015 | 2017 | 45 | 13 | 289 | |
| 238 | Lamont Thompson | DB | 2003 | 2006 | 64 | 17 | 266 | |
| 726 | Desmond King | FS | 2020 | 2020 | 9 | 2 | 222 | |
| 606 | Rashad Johnson | DB | 2016 | 2016 | 14 | 3 | 214 | |
| 447 | Calvin Lowry | DB | 2006 | 2007 | 32 | 6 | 188 | |
| 184 | Steve Jackson | DB | 1991 | 1999 | 118 | 22 | 186 | |
| 629 | Bobby Myers | DB | 2000 | 2001 | 17 | 3 | 176 | |
| 730 | Kendrick Lewis | FS | 2018 | 2018 | 13 | 2 | 154 | |
| 670 | Rich Coady | DB | 2002 | 2002 | 14 | 2 | 143 | |
| 751 | Daryl Porter | DB | 2001 | 2001 | 14 | 2 | 143 | |
| 387 | Perry Phenix | DB | 1998 | 2001 | 59 | 8 | 136 | |
| 414 | Amani Hooker | S | 2019 | 2022 | 52 | 7 | 135 | |
| 717 | Robert Johnson | S | 2011 | 2012 | 15 | 2 | 133 | |
| 572 | Brynden Trawick | S | 2017 | 2018 | 32 | 4 | 125 | |
| 778 | Joe Walker | DB | 2001 | 2001 | 16 | 2 | 125 | |
| 356 | Vincent Fuller | DB | 2005 | 2010 | 75 | 9 | 120 | |
| 425 | Daimion Stafford | FS | 2013 | 2016 | 62 | 7 | 113 | |
| 498 | Aric Morris | DB | 2000 | 2002 | 47 | 5 | 106 | |
| 605 | Marqueston Huff | FS | 2014 | 2015 | 30 | 3 | 100 | |
| 623 | Scott McGarrahan | DB | 2003 | 2004 | 32 | 3 | 94 | |
| 475 | Anthony Dorsett | DB | 1996 | 1999 | 56 | 5 | 89 | |
| 711 | Chris Jackson | S | 2020 | 2022 | 24 | 2 | 83 | |
| 785 | Al Afalava | DB | 2012 | 2012 | 12 | 1 | 83 | |
| 873 | Kevin Kaesviharn | DB | 2009 | 2009 | 13 | 1 | 77 | |
| 934 | Nick Schommer | DB | 2010 | 2010 | 13 | 1 | 77 | |
| 940 | Anthony Smith | DB | 2011 | 2011 | 13 | 1 | 77 | |
| 362 | Donnie Nickey | DB | 2003 | 2010 | 123 | 9 | 73 | |
| 834 | Matthias Farley | DB | 2021 | 2021 | 17 | 1 | 59 | |
| 895 | George McCullough | DB | 1997 | 2000 | 25 | 1 | 40 |

- Notes:
- Kevin Byard is on his way to the top
- Blaine Bishop was good
- Titan's trajectory over Michael Griffin's career was sad
- Some valuable short time contributors, and some long time legends
Position Grouping: WR
| Overall Rank | Player | PFR position | From | To | Games | AV | AV per game | |
|---|---|---|---|---|---|---|---|---|
| 122 | A.J. Brown | WR | 2019 | 2021 | 43 | 31 | 721 | |
| 30 | Derrick Mason | WR | 1997 | 2004 | 122 | 62 | 508 | |
| 270 | Yancey Thigpen | WR | 1998 | 2000 | 31 | 15 | 484 | |
| 150 | Corey Davis | WR | 2017 | 2020 | 56 | 26 | 464 | |
| 267 | Rishard Matthews | WR | 2016 | 2018 | 33 | 15 | 455 | |
| 87 | Drew Bennett | WR | 2001 | 2006 | 87 | 37 | 425 | |
| 548 | Julio Jones | WR | 2021 | 2021 | 10 | 4 | 400 | |
| 176 | Kevin Dyson | WR | 1998 | 2002 | 58 | 23 | 397 | |
| 85 | Nate Washington | WR | 2009 | 2014 | 96 | 38 | 396 | |
| 156 | Kendall Wright | WR | 2012 | 2016 | 66 | 26 | 394 | |
| 199 | Justin Gage | WR | 2007 | 2010 | 51 | 20 | 392 | |
| 181 | Kenny Britt | WR | 2009 | 2013 | 57 | 22 | 386 | |
| 222 | Justin McCareins | WR | 2001 | 2008 | 50 | 18 | 360 | |
| 243 | Willie Davis | WR | 1996 | 1998 | 45 | 16 | 356 | |
| 121 | Chris Sanders | WR | 1995 | 2001 | 97 | 32 | 330 | |
| 474 | Eric Decker | WR | 2017 | 2017 | 16 | 5 | 312 | |
| 716 | Marcus Johnson | WR | 2021 | 2021 | 7 | 2 | 286 | |
| 483 | Adam Humphries | WR | 2019 | 2020 | 19 | 5 | 263 | |
| 539 | Dorial Green-Beckham | WR | 2015 | 2015 | 16 | 4 | 250 | |
| 303 | Brandon Jones | WR | 2005 | 2008 | 51 | 12 | 235 | |
| 333 | Tajae Sharpe | WR | 2016 | 2019 | 47 | 11 | 234 | |
| 380 | Justin Hunter | WR | 2013 | 2015 | 35 | 8 | 229 | |
| 367 | Roydell Williams | WR | 2005 | 2007 | 40 | 9 | 225 | |
| 574 | Bobby Wade | WR | 2005 | 2006 | 18 | 4 | 222 | |
| 522 | Isaac Byrd | WR | 1997 | 1999 | 18 | 4 | 222 | |
| 750 | Carl Pickens | WR | 2000 | 2000 | 9 | 2 | 222 | |
| 457 | Taywan Taylor | WR | 2017 | 2018 | 29 | 6 | 207 | |
| 336 | Damian Williams | WR | 2010 | 2013 | 54 | 11 | 204 | |
| 494 | Dexter McCluster | WR | 2014 | 2015 | 25 | 5 | 200 | |
| 628 | Eric Moulds | WR | 2007 | 2007 | 16 | 3 | 188 | |
| 642 | Chester Rogers | WR | 2021 | 2021 | 16 | 3 | 188 | |
| 460 | George Wilson | WR | 2013 | 2014 | 32 | 6 | 188 | |
| 476 | Harry Douglas | WR | 2015 | 2017 | 27 | 5 | 185 | |
| 471 | Tyrone Calico | WR | 2003 | 2005 | 27 | 5 | 185 | |
| 410 | Lavelle Hawkins | WR | 2008 | 2012 | 52 | 7 | 135 | |
| 636 | Kalif Raymond | WR | 2019 | 2020 | 23 | 3 | 130 | |
| 638 | Darius Reynaud | WR | 2012 | 2013 | 23 | 3 | 130 | |
| 907 | Randy Moss | WR | 2010 | 2010 | 8 | 1 | 125 | |
| 700 | Derek Hagan | WR | 2014 | 2014 | 16 | 2 | 125 | |
| 865 | Andre Johnson | WR | 2016 | 2016 | 8 | 1 | 125 | |
| 641 | Courtney Roby | WR | 2005 | 2006 | 25 | 3 | 120 | |
| 511 | Nick Westbrook-Ikhine | WR | 2020 | 2022 | 43 | 5 | 116 | |
| 714 | Darius Jennings | WR | 2018 | 2019 | 24 | 2 | 83 | |
| 662 | Cameron Batson | WR | 2018 | 2021 | 27 | 2 | 74 | |
| 724 | Joey Kent | WR | 1997 | 1999 | 30 | 2 | 67 | |
| 619 | Marc Mariani | WR | 2010 | 2016 | 48 | 3 | 62 | |
| 581 | Eddie Berlin | WR | 2001 | 2004 | 57 | 3 | 53 |

- Notes:
- AJ Brown in 2022 and beyond would be nice. His production rate is extreme relative to Titans WRs
- Titans are not and have not been a WR team
- Nate Washington most recent long-time contributor
Position Grouping: DT
| Overall Rank | Player | PFR position | From | To | Games | AV | AV per game | |
|---|---|---|---|---|---|---|---|---|
| 42 | Albert Haynesworth | RDT | 2002 | 2008 | 90 | 54 | 600 | |
| 167 | Jason Fisk | RDT | 1999 | 2001 | 47 | 24 | 511 | |
| 159 | Jeffery Simmons | DL | 2019 | 2022 | 53 | 25 | 472 | |
| 148 | Gary Walker | LDT | 1995 | 1998 | 62 | 27 | 435 | |
| 69 | DaQuan Jones | DT | 2014 | 2020 | 99 | 43 | 434 | |
| 190 | John Thornton | LDT | 1999 | 2002 | 51 | 22 | 431 | |
| 285 | Sammie Lee Hill | DT | 2013 | 2015 | 38 | 13 | 342 | |
| 61 | Henry Ford | RDT | 1994 | 2002 | 129 | 44 | 341 | |
| 512 | Sylvester Williams | DT | 2017 | 2017 | 15 | 5 | 333 | |
| 235 | Randy Starks | RDT | 2004 | 2007 | 60 | 17 | 283 | |
| 565 | Shaun Smith | DT | 2011 | 2011 | 15 | 4 | 267 | |
| 288 | Sen'Derrick Marks | DT | 2009 | 2012 | 51 | 13 | 255 | |
| 220 | Josh Evans | DT | 1995 | 2001 | 71 | 18 | 254 | |
| 545 | Antonio Johnson | DT | 2013 | 2013 | 16 | 4 | 250 | |
| 748 | Kyle Peko | DT | 2021 | 2021 | 8 | 2 | 250 | |
| 350 | Al Woods | DT | 2014 | 2016 | 42 | 10 | 238 | |
| 580 | James Atkins | DT | 2003 | 2003 | 13 | 3 | 231 | |
| 344 | Austin Johnson | DT | 2016 | 2019 | 58 | 10 | 172 | |
| 508 | Teair Tart | DT | 2020 | 2022 | 31 | 5 | 161 | |
| 553 | Larrell Murchison | DL | 2020 | 2022 | 26 | 4 | 154 | |
| 608 | Naquan Jones | NT | 2021 | 2022 | 21 | 3 | 143 | |
| 449 | Mike Martin | DT | 2012 | 2015 | 46 | 6 | 130 | |
| 490 | Rien Long | DT | 2003 | 2005 | 39 | 5 | 128 | |
| 652 | Kevin Vickerson | DT | 2007 | 2009 | 24 | 3 | 125 | |
| 453 | Joe Salave'a | DT | 1998 | 2001 | 49 | 6 | 122 | |
| 732 | Isaiah Mack | DT | 2019 | 2020 | 19 | 2 | 105 | |
| 586 | Jared Clauss | DT | 2004 | 2005 | 29 | 3 | 103 | |
| 889 | Jesse Mahelona | DT | 2006 | 2006 | 10 | 1 | 100 | |
| 877 | Darius Kilgo | DT | 2018 | 2018 | 11 | 1 | 91 | |
| 663 | Angelo Blackson | DT | 2015 | 2016 | 29 | 2 | 69 | |
| 886 | Bennie Logan | DT | 2018 | 2018 | 15 | 1 | 67 | |
| 935 | Malcolm Sheppard | DT | 2010 | 2011 | 16 | 1 | 62 |

- Notes:
- don't remember Henry Ford well
- Jeffery Simmons will be a legend in time, to no suprise
- DaQuan Jones spent a longer time here than I thought
Position Grouping: CB
| Overall Rank | Player | PFR position | From | To | Games | AV | AV per game | |
|---|---|---|---|---|---|---|---|---|
| 46 | Samari Rolle | RCB | 1998 | 2004 | 101 | 52 | 515 | |
| 54 | Cortland Finnegan | RCB | 2006 | 2011 | 93 | 47 | 505 | |
| 277 | Adam Jones | DB | 2005 | 2006 | 30 | 14 | 467 | |
| 147 | Alterraun Verner | LCB | 2010 | 2013 | 64 | 27 | 422 | |
| 56 | Darryll Lewis | RCB | 1991 | 1998 | 113 | 47 | 416 | |
| 161 | Denard Walker | LCB | 1997 | 2000 | 61 | 25 | 410 | |
| 224 | Logan Ryan | CB | 2017 | 2019 | 45 | 18 | 400 | |
| 264 | Nick Harper | LCB | 2007 | 2009 | 38 | 15 | 395 | |
| 353 | Perrish Cox | RCB | 2015 | 2016 | 24 | 9 | 375 | |
| 175 | Andre Dyson | LCB | 2001 | 2004 | 62 | 23 | 371 | |
| 259 | Malcolm Butler | CB | 2018 | 2020 | 41 | 15 | 366 | |
| 247 | Adoree' Jackson | CB | 2017 | 2020 | 46 | 16 | 348 | |
| 92 | Jason McCourty | DB | 2009 | 2016 | 108 | 36 | 333 | |
| 708 | Roderick Hood | DB | 2009 | 2009 | 6 | 2 | 333 | |
| 722 | Johnathan Joseph | LCB | 2020 | 2020 | 7 | 2 | 286 | |
| 544 | Jackrabbit Jenkins | CB | 2021 | 2021 | 14 | 4 | 286 | |
| 324 | Reynaldo Hill | LCB | 2005 | 2008 | 48 | 11 | 229 | |
| 294 | Coty Sensabaugh | CB | 2012 | 2015 | 59 | 13 | 220 | |
| 462 | Blidi Wreh-Wilson | CB | 2013 | 2015 | 34 | 6 | 176 | |
| 584 | Breon Borders | CB | 2020 | 2021 | 17 | 3 | 176 | |
| 479 | Kristian Fulton | CB | 2020 | 2022 | 29 | 5 | 172 | |
| 938 | Buster Skrine | DB | 2021 | 2021 | 6 | 1 | 167 | |
| 627 | Elijah Molden | CB | 2021 | 2022 | 18 | 3 | 167 | |
| 844 | Brandon Ghee | CB | 2014 | 2014 | 6 | 1 | 167 | |
| 421 | Donald Mitchell | DB | 1999 | 2002 | 44 | 7 | 159 | |
| 493 | Brice McCain | DB | 2016 | 2017 | 32 | 5 | 156 | |
| 461 | Andre Woolfolk | DB | 2003 | 2006 | 39 | 6 | 154 | |
| 392 | LeShaun Sims | CB | 2016 | 2019 | 56 | 8 | 143 | |
| 713 | DeRon Jenkins | RCB | 2001 | 2001 | 15 | 2 | 133 | |
| 455 | Dainon Sidney | DB | 1998 | 2002 | 48 | 6 | 125 | |
| 573 | Michael Waddell | DB | 2004 | 2005 | 32 | 4 | 125 | |
| 887 | Greg Mabin | CB | 2021 | 2022 | 8 | 1 | 125 | |
| 668 | Chris Carr | DB | 2008 | 2008 | 16 | 2 | 125 | |
| 854 | Chris Hawkins | CB | 2011 | 2011 | 9 | 1 | 111 | |
| 961 | B.W. Webb | CB | 2015 | 2015 | 9 | 1 | 111 | |
| 552 | Ryan Mouton | DB | 2009 | 2012 | 36 | 4 | 111 | |
| 523 | Tommie Campbell | DB | 2011 | 2013 | 37 | 4 | 108 | |
| 468 | Tony Beckham | DB | 2002 | 2005 | 50 | 5 | 100 | |
| 583 | Michael Booker | DB | 2000 | 2001 | 31 | 3 | 97 | |
| 852 | Brandon Harris | CB | 2014 | 2014 | 11 | 1 | 91 | |
| 930 | Curtis Riley | CB | 2016 | 2017 | 11 | 1 | 91 | |
| 526 | Dane Cruikshank | CB | 2018 | 2021 | 44 | 4 | 91 | |
| 646 | Tye Smith | CB | 2017 | 2020 | 36 | 3 | 83 | |
| 610 | Eric King | DB | 2006 | 2008 | 36 | 3 | 83 | |
| 691 | Rich Gardner | DB | 2004 | 2005 | 28 | 2 | 71 | |
| 929 | Cody Riggs | CB | 2015 | 2016 | 14 | 1 | 71 | |
| 796 | Antwon Blake | CB | 2016 | 2016 | 16 | 1 | 62 | |
| 903 | Christopher Milton | CB | 2019 | 2020 | 20 | 1 | 50 | |
| 874 | Joshua Kalu | CB | 2018 | 2022 | 40 | 1 | 25 |

- Notes:
- Samari Rolle was good!
- did Pacman's returns contribute to his AV?
- similar to LB, not long careers of recent; Jason McCourty left after 2016
Position Grouping: TE
| Overall Rank | Player | PFR position | From | To | Games | AV | AV per game | |
|---|---|---|---|---|---|---|---|---|
| 102 | Delanie Walker | TE | 2013 | 2019 | 84 | 35 | 417 | |
| 48 | Frank Wycheck | TE | 1995 | 2003 | 137 | 50 | 365 | |
| 262 | Jared Cook | TE | 2009 | 2012 | 59 | 15 | 254 | |
| 409 | Jackie Harris | TE | 1998 | 1999 | 28 | 7 | 250 | |
| 188 | Bo Scaife | TE | 2005 | 2010 | 90 | 22 | 244 | |
| 230 | Erron Kinney | TE | 2000 | 2005 | 83 | 17 | 205 | |
| 311 | Jonnu Smith | TE | 2017 | 2020 | 60 | 12 | 200 | |
| 321 | Anthony Firkser | TE | 2018 | 2021 | 58 | 11 | 190 | |
| 393 | Ben Troupe | TE | 2004 | 2007 | 55 | 8 | 145 | |
| 527 | Alge Crumpler | TE | 2008 | 2009 | 31 | 4 | 129 | |
| 593 | Anthony Fasano | TE | 2015 | 2016 | 32 | 3 | 94 | |
| 703 | Ben Hartsock | TE | 2006 | 2007 | 22 | 2 | 91 | |
| 648 | Geoff Swaim | TE | 2020 | 2022 | 39 | 3 | 77 | |
| 558 | MyCole Pruitt | TE | 2018 | 2021 | 58 | 4 | 69 | |
| 560 | Michael Roan | TE | 1995 | 2000 | 62 | 4 | 65 | |
| 624 | Shad Meier | TE | 2001 | 2004 | 52 | 3 | 58 | |
| 945 | Luke Stocker | TE | 2017 | 2018 | 19 | 1 | 53 | |
| 507 | Craig Stevens | TE | 2008 | 2015 | 109 | 5 | 46 | |
| 947 | Phillip Supernaw | TE | 2015 | 2017 | 47 | 1 | 21 |

- Notes:
- Walker and Wycheck are legends
- Jonnu Smith, Anthony Firkser just under Jared Cook. Smith's production suffered an increased blocking role with poor Tackle play.
- Titans have had a few TEs with steady production over a lot of years
Position Grouping: ST
| Overall Rank | Player | PFR position | From | To | Games | AV | AV per game | |
|---|---|---|---|---|---|---|---|---|
| 75 | Al Del Greco | K | 1991 | 2000 | 151 | 40 | 265 | |
| 105 | Rob Bironas | K | 2005 | 2013 | 144 | 34 | 236 | |
| 394 | Gary Anderson | K | 2003 | 2004 | 30 | 7 | 233 | |
| 236 | Ryan Succop | K | 2014 | 2019 | 86 | 17 | 198 | |
| 451 | Joe Nedney | K | 2001 | 2003 | 33 | 6 | 182 | |
| 126 | Brett Kern | P | 2009 | 2021 | 197 | 30 | 152 | |
| 151 | Craig Hentrich | P | 1998 | 2009 | 177 | 26 | 147 | |
| 693 | Stephen Gostkowski | K | 2020 | 2020 | 15 | 2 | 133 | |
| 585 | Randy Bullock | K | 2021 | 2022 | 27 | 3 | 111 | |
| 370 | Beau Brinkley | LS | 2012 | 2020 | 135 | 8 | 59 | |
| 813 | Morgan Cox | LS | 2021 | 2022 | 30 | 1 | 33 |

- Notes:
- Positional grouping broken apart as positional value is not similar
- RIP Rob Bironas
- will Stonehouse join legends, Hentrich and Kern?
- Gary Anderson wore the best helmets.
Punter Analysis
- Punter Analysis Contents
- Punt Data Analysis
- Titans Punters, 2009-current
- Part I - Brett Kern History, Titans stats
- Part II - Brett Kern ('17-19) vs Ryan Stonehouse
- Part III - Ryan Stonehouse vs NFL - 2022 season
Introduction - Analyzing Punt Data 2022 season data updated as of Mon Jan 9 15:24:21 2023
The table shows all punts by Brett Kern and Ryan Stonehouse as Titans against all other punts from the 2009 - 2022 seasons.
Some punt metrics are shown in the table, and are discussed below.
All punt data was combined for the introduction section. Focused analyses follow in the next sections.
The last two rows are metrics provided by Puntalytics;
these and some of their other metrics are discussed at the
end of this section. These "advanced" metrics will be denoted with a *.
| B.Kern | R.Stonehouse | Rest of NFL | |
|---|---|---|---|
| Punts | 962 | 90 | 32,731 |
| Blocked | 5 | 0 | 179 |
| Touchback | 5.4% | 10.0% | 7.1% |
| Inside Twenty | 40.5% | 33.3% | 35.2% |
| Fair Catch | 24.9% | 12.2% | 25.6% |
| Out Of Bounds | 14.3% | 1.1% | 9.7% |
| Returned | 44.8% | 65.6% | 56.0% |
| EPA/play | 0.007 | 0.055 | -0.071 |
| punt EPA* | 0.084 | 0.207 | 0.013 |
| Adj. Net* | 102.7 | 106.3 | 100.4 |
Adj. Net* is a unitless measure (does not correspond to yards). It ranges from 0-160, with some outliers.
Most punts have an Adj. Net* of 50-150
2022 Puntalytics data updated as of 12/30/23
To start, I decided to visualize various punter metrics against, "Yards-to-go", which I call distance from the line-of-scrimmage to the opponent's endzone, typically at least 40 yards (~57 yard field goal) for punts. This normalizes the distance metrics, gross and net yards, as a punter can only punt as far as the space they have. The graphs below show how punt distance and punt attempts vary with Yards to go.
Average gross and net yards for a punt are illustrated by the shading, and the smaller bars | | indicate the uncertainty for the interval. Each metric initially increases with yards to go (YTG), then settles at a steady value. This indicates an average distance limitation for punters. In the flat region, there is an area between gross and net yards. It represents the average punt yards lost to returns and other factors, like touchbacks. In the sloping region, at low YTG, punts were more likely to net their distance, as returns (especially longer ones) are less likely.
The second chart shows how punt attempts varied with yards to go. Punts were grouped into small YTG bins, the bin counts are shown by the bars. The solid line approximates this distribution, and is used in later sections. It is helpful to remember if a punt is likely from a certain YTG when considering if data in the charts are meaningful. The first chart shows highest uncertainty at over 95 YTG, where very few punts were attempted. Note that punt distance wasn't presented for less than 40 YTG.


A number of punt metrics are binary stats, whose rates and meanings may change with YTG. These metrics either happened 1 or didn't happen 0. Note the scale of the y-axis in the following charts.
The first example shows Out Of Bounds (OOB) rate. It appears to have little in relation with YTG, and high variation across the YTG range. Within error, it seems to stay within its 10% overall average.
Touchbacks may be undesireable from close (just 30 net yds from the 50), but impressive and very difficult from distance. It seems most punters wouldn't want a touchback in the region where their rate is above overall average (40-60 YTG), and wouldn't mind as much where they are below (>60 YTG).
Downed punt rate also decays with YTG, and may follow similar reasoning as touchbacks. Unless a punt is very short relative to YTG, it being downed implies a more favorable outcome than a touchback.

Fair catches are most common, and well above overall average for short punts, when a punter is focusing more on pinning the opponent deep instead of maximizing distance.
An "Inside Twenty" metric provides a rough indication of pinning opponents. Landing an opponent inside their twenty is more generally a good thing than some of the other binary metrics, and more impressive from greater distance.

The charts above show how the binary punt metrics are distributed with YTG. These data will be presented more simplistically in Part I, by fitting linear regressions to quickly compare punting tendencies. The bar charts show that linear relationships may not describe all the metrics with YTG. The following charts show a logistic regression modelled for the binary metrics, and more clearly show if a linear fit is appropriate for a metric.


Similarly, recall punt distance was not linear over the range of common YTG. Second and Third order polynomial fits were compared to First order (linear). Either of the higher orders are better than fitting a straight line, and are used in place of linear fits when comparing punter distances against YTG.


EPA per punting play may not be very indicative of punter performance, as punters don't chose when to punt. Punts from short distance will never be considered a success, EPA > 0. And punts are generally not deemed favorably by a metric which is about scoring points, not about effectively giving the ball back to opponents. I expect a punter's EPA/play for a given team might be most influenced by their coach's 4th down decision making and surrounding factors, such as kicker/offense ability, game situation, etc. . .
Thankfully people have taken the time and effort to normalize against these factors. The Puntalytics team calculated more realistic expected points for a punting play, and also added ERA adjustement to account for changes in punter behaviour/ability over time. For this page, this metric will be referred to as Punt EPA*. The bar graph indicates it's more normalized about 0, and therefore may be more useful than EPA when comparing punters or assessing success.

Punt EPA* will be used in place of traditional EPA for the Punting graphs and discussion. Both will be presented in tables. A few other Puntalytics metrics will be presented. These serve to normalize for some of the factors discussed above:
- RERUN - adjusts Net Yards for returned punts --> expected return distance increases with punt distance, returns longer than expected don't penalize the punter
- SHARP - adjusts Gross Yards for Yards to go --> accounts for maximum limitation with high YTG and touchback limitation for low YTG, see graph above
- SHARP RERUN - Net yardage metric considering both SHARP and RERUN, called Adj. Net* in tables
- Pin Deep/Open Field - classification for punts based on YTG --> provides context to punting situations/goals
-
As noted above, SHARP and SHARP RERUN do not correspond to yards. They approximately range from 0-160, and most punts are 50-150
Titans Punters from 2009-2022
a brief history
| season | Punter | Punts | |
|---|---|---|---|
| 2009 | R.Bironas | 1 | |
| 2009 | C.Hentrich | 9 | |
| 2009 | R.Hodges | 22 | |
| 2009 | B.Kern | 37 | |
| 2010 | B.Kern | 77 | |
| 2011 | B.Kern | 86 | |
| 2012 | B.Kern | 83 | |
| 2013 | B.Kern | 79 | |
| 2014 | B.Kern | 89 | |
| 2015 | B.Kern | 88 | |
| 2016 | B.Kern | 77 | |
| 2017 | B.Kern | 85 | |
| 2018 | B.Kern | 75 | |
| 2019 | B.Kern | 93 | |
| 2020 | T.Daniel | 5 | |
| 2020 | B.Kern | 42 | |
| 2020 | R.Allen | 8 | |
| 2021 | B.Kern | 51 | |
| 2021 | J.Townsend | 11 | |
| 2022 | R.Stonehouse | 90 |
- Timeline
Prologue Craig Hentrich re-signed with the Titans in 2009, but got hurt in Week 2. He finished the year on IR and then retired after his 17th season. He was the last remaining member of the Titans '99 Super Bowl team.- 2009 Titans acquire Brett Kern after he was waived by the Broncos, and steal his magic juice
- 2010-2016 Kern punts for the Titans, providing a bright spot for fans watching games in the worst of times.
- 2017-2021 Kern earns Pro Bowl honors (2017-2019) and a 1st-Team All-Pro (2019) as the primary veteran responsible for the Titans resurgence through the Mularkey and into the Vrabel era.
- 2022 Titans turn the reigns to UDFA Ryan Stonehouse. Kern was acquired by Eagles after Week 14, cementing their claim to the Super Bowl.
I cannot find the source of this image, if I do I will attribute photographer.
Part I - Brett Kern History
2009-2021 play-by-play data: punt-attempts
Brett Kern's Titans punts were separated from the rest of the dataset for comparison.
This dataset was used to get a feel for how to assess individual punter data. I will propose interpreations, and demonstrate some interesting trends over Brett Kern's career as a Titan. The section focuses on a subset of the data, 2017-2019, Kern's Pro Bowl years. These will provide a standard of high-quality punting in Part II - Brett Kern vs Ryan Stonehouse.
From 2017-2019, Brett Kern attempted 253 punts and all punters attempted 6,849 punts.
The KDE plot shows a similar distribution of Punts attempts with Yards to go. Therfore the following regression plots may provide fair comparisons. More error at extremes of YTG are expected, due to much lower attempts. Such spread may be amplified for Kern, who is being compared to all other punters at large.


Binary metrics (happened / didn't happen) were considered
by estimating linear regressions and confidence intervals.
When the regression lines dip below 0%, they indicate an
extremely low likelihood of occurence, and conversely indicate almost all punts
achieved the metric if over 100%.
The first two metrics shown are more obvious to interpret, punts that:
- Land Inside the Opponent's 20
- Result in a Touchback
The graphs paint a less obvious picture for Touchbacks, which are generally undesirable. 2018 may be his best year shown, but in 2019, he may have landed achieved more Touchbacks from great distance (less than 80 Yards to go), which may be assumed a positive result.
The next three metrics shown are less obvious to interpret, and could be considered an indication of punter style. Punts that:
- Land Out of bounds
- Are Downed
- Are Fair caught
Punts that land Out of bounds (OOB) are probably good; Brett Kern was exceptional during this time period.
OOB punts from further away might be less impressive if net yards suffer. More on this in the two charts below.
Downed punts and fair catches follow similar reasoning. Although punts resulting in a fair catch may be less impressive from further away.
The three considered together may show a punter's tendencies. Perhaps Kern was confident in his ability to punt OOB and did not need to rely on rolling or hanging punts.

Kern Becomes an OOB Technician after 2016
The box plot more directly (refer to binary metrics) shows that Kern punted OOB more often than the rest of the NFL. The larger bars indicate a greater rate, and higher values indicate OOB punts from a greater distance. Interestingly, Kern was not punting like this before 2017.

Viewing the collection of binary metrics shows that while Kern had a higher OOB rate, the actual rate of his
punts returned may be similar to the NFL, considering his lower Downed and Fair Catch (and touchback) rates.
To check, I calculated a "returned" binary, for punts that were not fair caught, blocked, OOB, downed, or touchbacks.
This graph shows Kern was allowing less returns than the NFL early in his career.
Kern took it to a new level after 2016!
Excepting touchbacks, unreturned punts ensure that net yards will be equal to gross yards. This is great, unless
a punt's distance is sacrificed to minimize chances of a return.
Did Kern's style result in better net yards, or does it indicate shallower punts (gross yards) in general?
Punt Return Rate vs Yards to go 2009-2021

Best years by Normalized Net Yards
The relatively high OOB rate started in 2017, where Kern's net yards were still similar to the rest
of the pack. But from 2018-2020, Kern performed well in net yards relative the league.
This indicates his OOB punts were effective.
Although net yards may not always isolate a punter's performance, for example it may suffer with an unfortunate missed tackle,
Kern is a team player
and takes full responsibility for the unit's performance as a whole.
While 2020 looks to be better than 2017 by net yards, the Pro Bowl years ('17-'19) will continue to be Kern's golden range
with the Titans for consideration against Ryan Stonehouse. Also note that the Titans punted relatively little during the 2020 season.
What do you think?
Check out the Full Picture.

| B.Kern | Rest of NFL | |
|---|---|---|
| Punts | 253 | 6,849 |
| Blocked | 1 | 38 |
| Touchback | 5.5% | 6.1% |
| Inside Twenty | 45.1% | 37.4% |
| Fair Catch | 19.8% | 27.4% |
| Out Of Bounds | 20.9% | 10.1% |
| Returned | 44.3% | 54.7% |
| EPA/play | 0.070 | -0.105 |
| punt EPA* | 0.160 | 0.008 |
| Adj. Net* | 105.1 | 100.2 |

Gross, Net Yards vs Yards to Go 2017-2019

Punt EPA* vs Yards to Go 2017-2019


Part II - Kern (2017-2019) vs Stonehouse (2022)
2017-2022 play-by-play data: punt-attempts
Ryan Stonehouse '22 vs. Brett Kern '17-'19
In the previous section, it was shown that Brett Kern outperformed other NFL punters in his Pro Bowl years by comparing their Normalized Net Yards (net yards / yards to go). It was also shown that Kern may have used OOB punts to realize his performance, and that his style was not typical of NFL punters.
This chart may help interpret the actual values for normalized net yards. Consider the following play desription:
(:25) 6-B.Kern punts 58 yards to NE 1, Center-48-B.Brinkley, downed by TEN-29-D.Cruikshank.
It was from 59 YTG, and netted 58 yds (0.98 normalized net yards).
That incredible punt was well above average.

In this section, Kern's high performance years will be compared to Ryan Stonehouse's current season. How has Stonehouse done relative to the recent glory years of Titans punting?
2022 Puntalytics dataset updated on 12/30/23
Stonehouse punts very differently than Kern. He almost never punts OOB, forces less fair catches, and punts more touchbacks. The first two contribute to his much higher allowed return rate. The KDE shows that Stonehouse is typically punting from greater distance, which might explain some of the differences (and is a sad picture of the Titans 2022 offense).
| B.Kern '17-'19 | R.Stonehouse | |
|---|---|---|
| Punts | 253 | 90 |
| Blocked | 1 | 0 |
| Touchback | 5.5% | 10.0% |
| Inside Twenty | 45.1% | 33.3% |
| Fair Catch | 19.8% | 12.2% |
| Out Of Bounds | 20.9% | 1.1% |
| Returned | 44.3% | 65.6% |
| EPA/play | 0.070 | 0.055 |
| punt EPA* | 0.160 | 0.207 |
| Adj. Net* | 105.1 | 106.3 |

While Stonehouse allows more returns than Kern did, he is punting the ball far. This is shown by his high gross yards. The returns and/or touchbacks bring Stonehouse's net yards to a very similar distribution as Kern's. These are both better than NFL average.
The regression plots show how these tendencies vary with punt distance. As would be expected, Stonehouse's far punts are exemplified by his high gross yards when he has room, high YTG. At lower YTG, when a big punt would just result in a touchback, Kern's OOB punting style gave him more net yards than Stonehouse. But at longer distances, Stonehouse is performing similarly or better than Kern regardless of returns/touchbacks.


The effect of returns on net yards is more closely examined in the scatter plot. All punting data, 2009-2022, was grouped by punter and season, and then all seasons with at least 30 punts were plotted. A slight trend of better net with lower return rate is apparent. Kern's recent seasons are at or below average for return rate, while Stonehouse has allowed one of the higher return rates in the dataset.

Kern's seasons show the relatively high net yards and low return rate presented in the previous section. The Pro Bowl subset, '17-'19, were three of his five best by normalized net yards. The other two, 2009 and 2020, were relatively low punting seasons (37,42).
Stonehouse's solitary season exemplifies his abnormally high net yards, despite high return rate. This was accomplished by having high YTG, and booming the ball.
In conclusion, the Titans should be looking forward to a fruitful transition from one punting legend to a promising star. By my metric of choice, Net yards / Yards to go aka Normalized Net Yards, Kern has developed consistent performance over his career. He did this by minimizing opponent return opportunities and punting out-of-bounds. This season, Stonehouse has performed similarly to Kern's best years, and has done so by punting very differently. He has punted far enough that returns or touchbacks have not hurt his normalized net yards.


Linear Regression for various Binary Metrics with YTG
These charts provide more context to the averages presented in the table. Note that linear fits are not always appropriate, and may not provide a good view of a metrics relationship with YTG. Charts are best used to roughly compare punter tendencies.


Punters are Players - Titans
2009-2022 play-by-play data: plays where a Titan who punted passes/rushes/receives/tackles
EPA percentile is relative to the 2022 NFL play-by-play dataset,
QB epa used for passing.
The tables below show all passing, rushing, receiving, and tackling for Titans punters from 2009-2022. The offensive stats contain an EPA percentile column, which shows the punter's EPA/play relative to all plays in 2022, for convenience. Some of the passes and rushes were on botched plays, click the Punter Name Buttons to see the detailed play descriptions.
dataset updated on Mon Jan 9 15:24:21 2023
Punters are Players!
| Attempts | Y/A | Comp % | TD | Int | EPA/play | EPA percentile | |
|---|---|---|---|---|---|---|---|
| B.Kern | 6 | 6.5 | 33% | 0 | 0 | 0.28 | 61 |
2019 Week 7 - TEN at LAC: (8:18) (Punt formation) 6-B.Kern pass short left to 31-K.Byard to LAC 32 for 11 yards (57-J.Brown).
2019 Week 15 - TEN at HOU: (1:14) (Punt formation) 6-B.Kern pass incomplete deep right to 29-D.Cruikshank (32-L.Johnson).
2019 Week 20 - KC at TEN: (6:07) (Punt formation) 6-B.Kern pass short middle to 37-A.Hooker to 50 for 28 yards (17-M.Hardman).
2020 Week 7 - TEN at PIT: (:21) (Punt formation) 6-B.Kern Aborted. 48-B.Brinkley FUMBLES at TEN 18, recovered by TEN-6-B.Kern at TEN 18. 6-B.Kern pass incomplete deep left to 87-G.Swaim. Penalty on TEN-48-B.Brinkley, Ineligible Downfield Pass, declined.
2020 Week 8 - CIN at TEN: (Kick formation) TWO-POINT CONVERSION ATTEMPT. 6-B.Kern pass to 94-J.Crawford is incomplete. ATTEMPT FAILS. DEFENSIVE TWO-POINT ATTEMPT. 56-J.Bynes intercepted the try attempt. ATTEMPT FAILS.
| Attempts | Y/A | First Down % | TD | Fumbles | EPA/play | EPA percentile | |
|---|---|---|---|---|---|---|---|
| B.Kern | 3 | 0.0 | 0% | 0 | 2 | -2.96 | 1 |
2013 Week 6 - SEA at TEN: (1:01) (Punt formation) 6-B.Kern FUMBLES (Aborted) at TEN 38, and recovers at TEN 38. 6-B.Kern to TEN 38 for no gain (42-C.Maragos).
2019 Week 8 - TEN at TB: (3:45) (Field Goal formation) 6-B.Kern left end to TB 28 for no gain (45-D.White).
| Solo | Asst | for Loss | |
|---|---|---|---|
| R.Bironas | 1 | ||
| B.Kern | 2 | ||
| J.Townsend | 1 | ||
| R.Stonehouse | 2 |
2018 Week 4 - TEN at PHI: (1:54) (Punt formation) 6-B.Kern punts 54 yards to PHI 19, Center-48-B.Brinkley. 16-D.Carter to TEN 39 for 42 yards (6-B.Kern).
2022 Week 14 - TEN at JAX: (5:29) 4-R.Stonehouse punts 53 yards to JAX 42, Center-46-M.Cox. 39-J.Agnew ran ob at JAX 49 for 7 yards (4-R.Stonehouse). PENALTY on JAX-6-C.Claybrooks, Offensive Holding, 10 yards, enforced at JAX 47.
Ryan Stonehouse vs. Rest of NFL - 2022 season
2022 play-by-play data: punt-attempts
Titans rookie punter, Ryan Stonehouse, was separated from the rest of the dataset for comparison.
This section evaluates Titans rookie Ryan Stonehouse against all other NFL punters in 2022. The first part compares him to the NFL average, where he performs well. As the 2022 season ends, I will add definitive individual punter analysis to see how he compares to the league's best. For now, some charts are displayed to evaluate individual punters in 2022. All graphs are updated with the displayed date, but the words may lag behind until the season ends.
2022 Puntalytics dataset updated on 12/30/23

| Punter | Punts | Team | |
|---|---|---|---|
| C.Waitman | 96 | DEN | |
| R.Stonehouse | 90 | TEN | |
| C.Johnston | 88 | HOU | |
| T.Way | 83 | WAS | |
| B.Mann | 83 | NYJ | |
| J.Hekker | 81 | CAR | |
| J.Camarda | 79 | TB | |
| B.Gillikin | 77 | NO | |
| J.Gillan | 75 | NYG | |
| R.Wright | 74 | MIN | |
| R.Dixon | 73 | LAR | |
| J.Scott | 73 | LAC | |
| M.Haack | 71 | IND | |
| P.Harvin | 69 | PIT | |
| B.Anger | 68 | DAL | |
| A.Lee | 68 | ARI | |
| T.Gill | 67 | CHI | |
| M.Dickson | 66 | SEA | |
| B.Pinion | 62 | ATL | |
| M.Wishnowsky | 61 | SF | |
| C.Bojorquez | 61 | CLE | |
| T.Morstead | 61 | MIA | |
| A.Cole | 59 | LV | |
| L.Cooke | 58 | JAX | |
| J.Stout | 57 | BAL | |
| P.O'Donnell | 54 | GB | |
| T.Townsend | 53 | KC | |
| J.Fox | 52 | DET | |
| S.Martin | 46 | BUF | |
| A.Siposs | 45 | PHI | |
| M.Palardy | 43 | NE | |
| J.Bailey | 37 | NE | |
| K.Huber | 31 | CIN | |
| D.Chrisman | 28 | CIN | |
| B.Kern | 10 | PHI | |
| J.Elliott | 1 | PHI |
| Rest of NFL | R.Stonehouse | |
|---|---|---|
| Punts | 2,110 | 90 |
| Blocked | 12 | 0 |
| Touchback | 7.1% | 10.0% |
| Inside Twenty | 37.1% | 33.3% |
| Fair Catch | 28.3% | 12.2% |
| Out Of Bounds | 8.9% | 1.1% |
| Returned | 42.3% | 65.6% |
| EPA/play | -0.099 | 0.055 |
| punt EPA* | 0.010 | 0.207 |
| Adj. Net* | 100.3 | 106.3 |

Unfortunately, the Titans offense has provided Ryan Stonehouse with a lot of punt opportunities. As shown above, he is currently #2 in the league with 90 punts. He has a similar touchback and inside twenty rate as the rest of the NFL, but has less punts that are fair caught or land OOB. This suggests that more of his punts are returned than average. Comparing punts' gross to net yards will give a sense of yards lost to returns.
Stonehouse punts the ball further than the rest of the NFL, as shown by his normalized gross yards. Currently, this is his most impressive trait. However his net yards are not as high. The strong punting of Stonehouse makes him really good, but when he finds a way to maintain distance and minimize returns, he will become elite. As shown in Part I, Kern sent his punts OOB to achieve high net yards and inside twenty percentage.


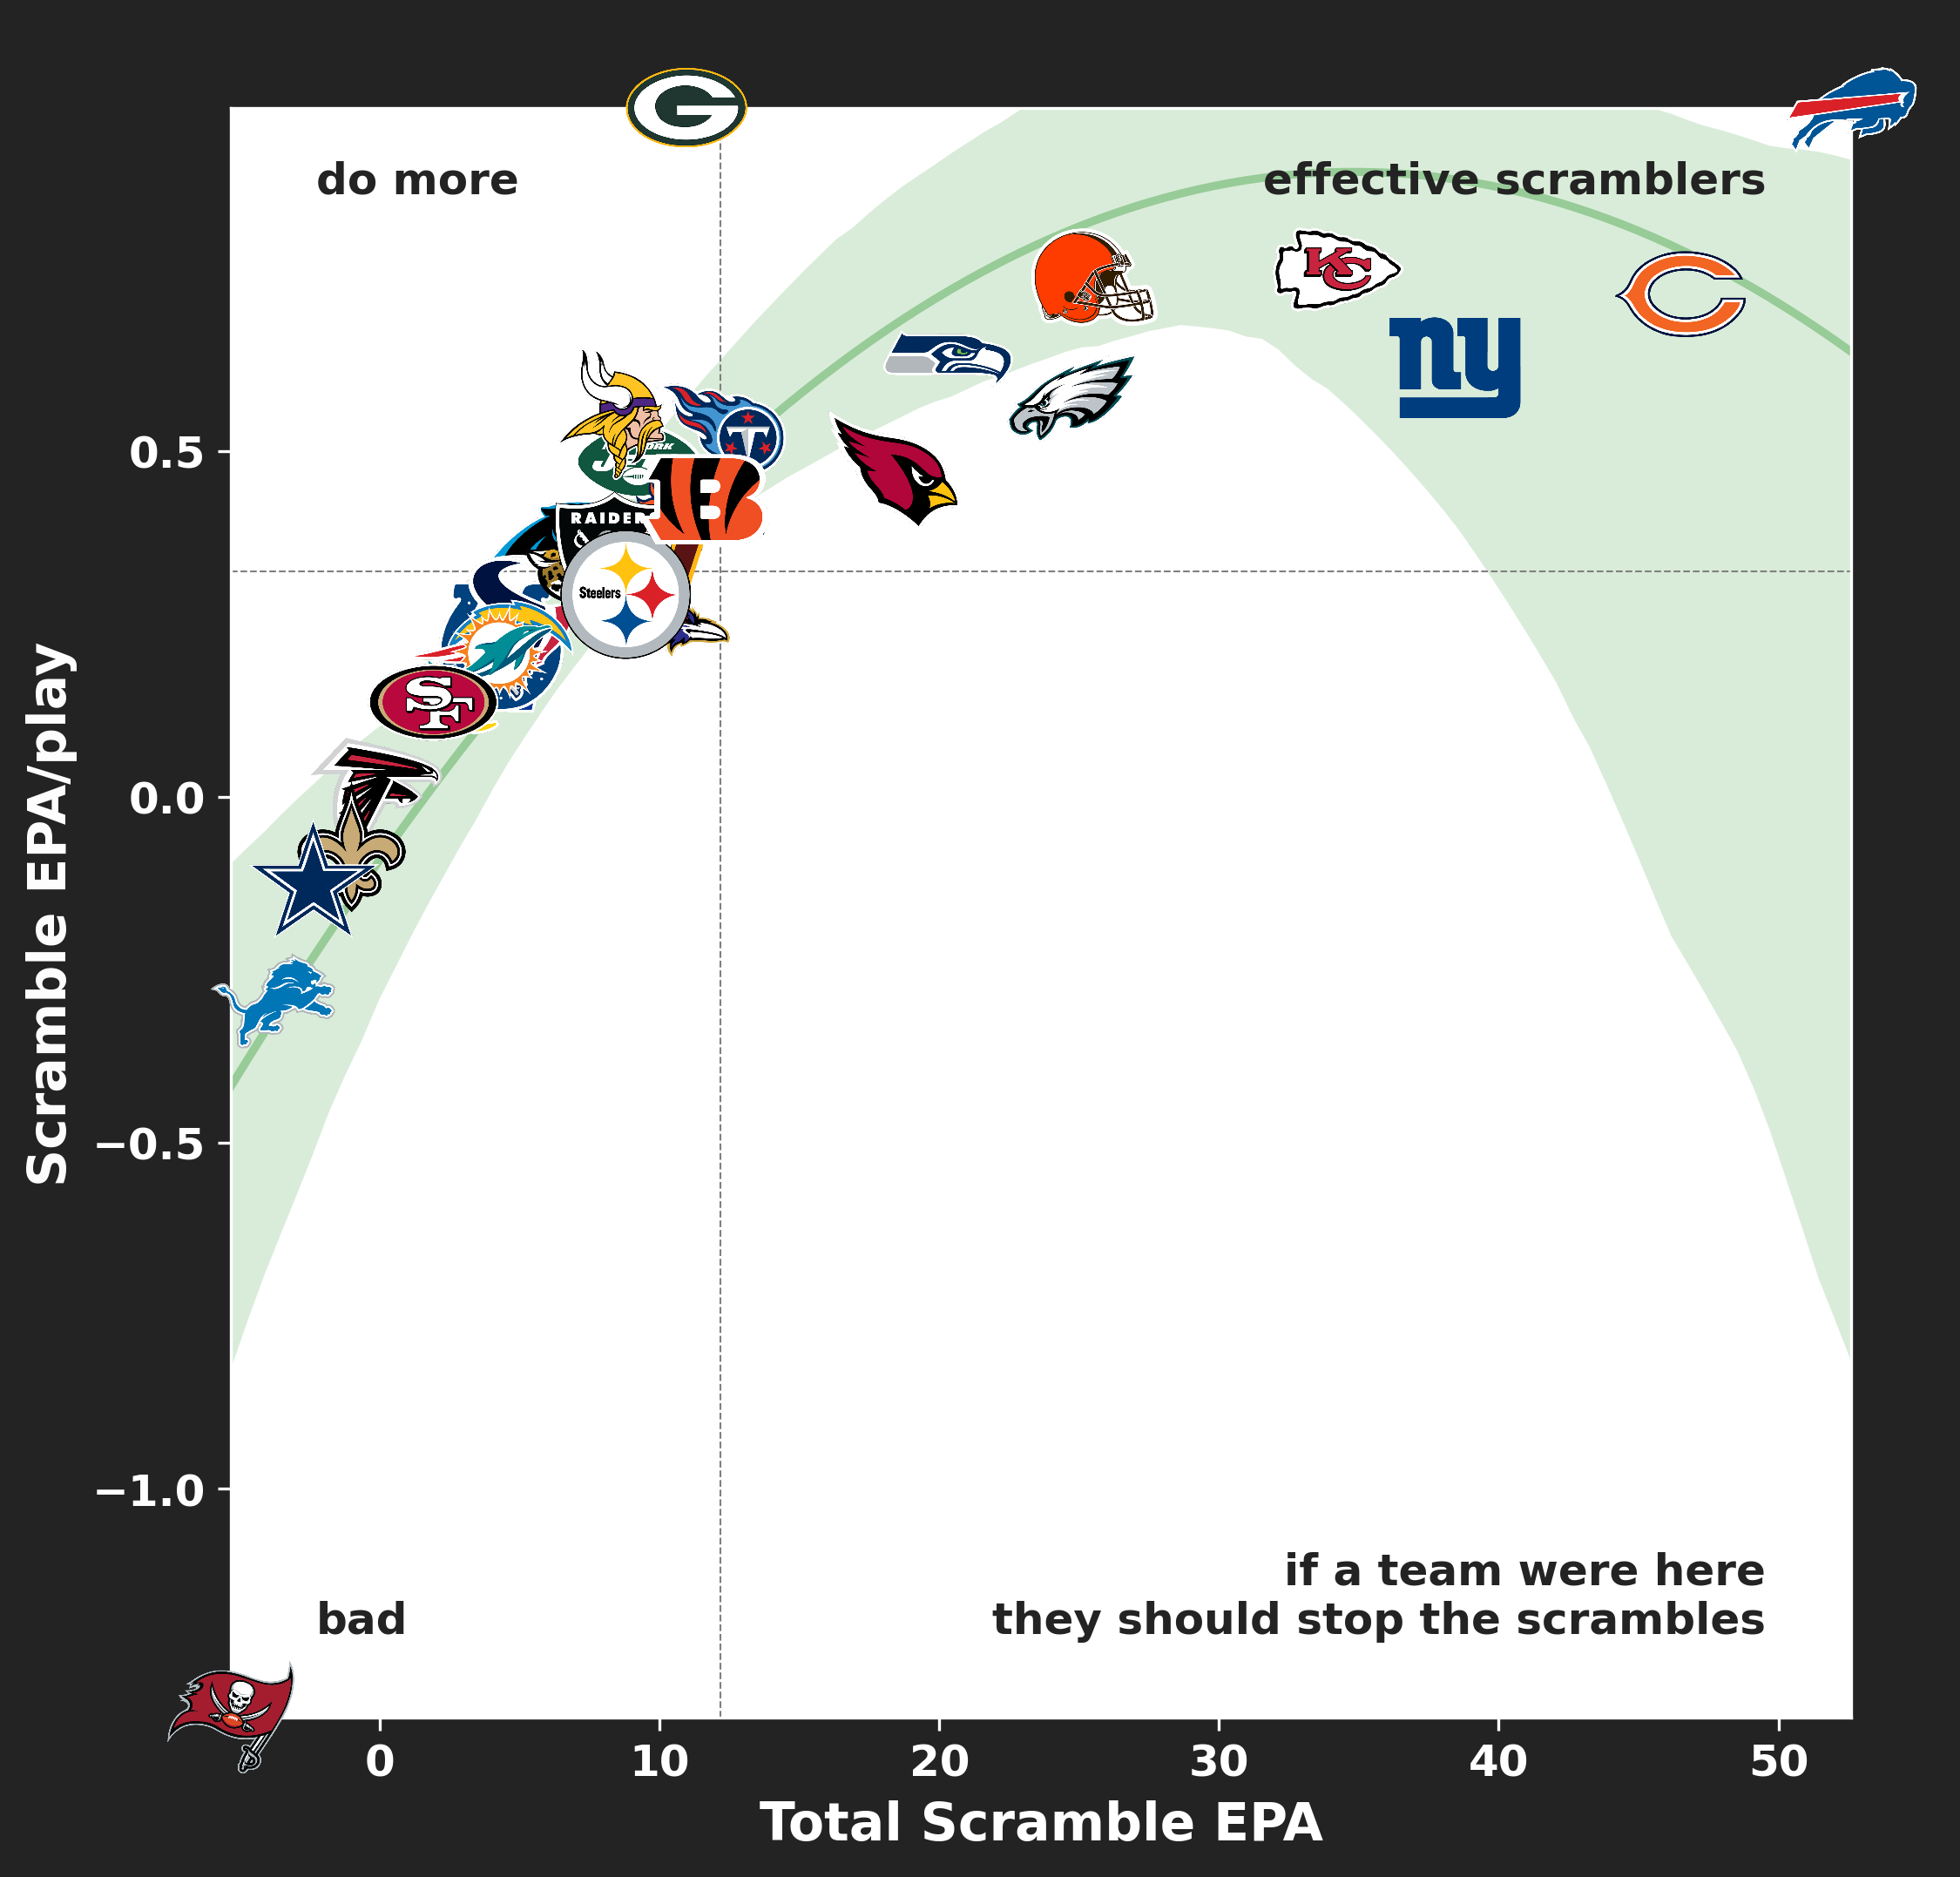
Individual Punter Analysis
As discussed in the previous section, Stonehouse has a good normalized net yardage
desipite allowing a lot of returns. By contrast, Kern achieved his best net yardage with low return rates. And it seemed
that better performance with lower return rate was an, at least weak, historical trend in the NFL.
The chart below shows no trend for the 2022 season. The best and worst punters by
normalized net yards span the range of return rate allowed. This may be expected with varied punting styles and
varied punting situations, as a single season's data is more influenced by team performance.
Stonehouse has allowed the most returns on his punts, but is still amongst the top of the league in netting his YTG.
Other punters show similar performance, indicating similar styles. These will be examined in subsequent graphs.
To start, let's see if the best netters with returns allowed are the ones punting far AKA gross.
Normalized Net Yards vs Return Rate, Table sorted by normalized net yards (Norm.Net)

| Team | Name | Norm.Net | Return% | Punts | |
|---|---|---|---|---|---|
| JAX | L.Cooke | 0.698 | 50% | 58 | |
| KC | T.Townsend | 0.694 | 42% | 53 | |
| CAR | J.Hekker | 0.687 | 33% | 81 | |
| SF | M.Wishnowsky | 0.683 | 28% | 61 | |
| LV | A.Cole | 0.676 | 42% | 59 | |
| WAS | T.Way | 0.668 | 41% | 83 | |
| HOU | C.Johnston | 0.667 | 51% | 88 | |
| SEA | M.Dickson | 0.666 | 53% | 66 | |
| LAC | J.Scott | 0.666 | 26% | 73 | |
| CLE | C.Bojorquez | 0.662 | 43% | 61 | |
| NO | B.Gillikin | 0.660 | 34% | 77 | |
| BAL | J.Stout | 0.659 | 39% | 57 | |
| TEN | R.Stonehouse | 0.657 | 66% | 90 | |
| MIA | T.Morstead | 0.653 | 51% | 61 | |
| MIN | R.Wright | 0.652 | 51% | 74 | |
| DAL | B.Anger | 0.649 | 47% | 68 | |
| BUF | S.Martin | 0.647 | 35% | 46 | |
| ATL | B.Pinion | 0.646 | 40% | 62 | |
| PHI | A.Siposs | 0.636 | 44% | 45 | |
| GB | P.O'Donnell | 0.633 | 37% | 54 | |
| DEN | C.Waitman | 0.629 | 46% | 96 | |
| NYG | J.Gillan | 0.629 | 37% | 75 | |
| IND | M.Haack | 0.628 | 37% | 71 | |
| DET | J.Fox | 0.625 | 58% | 52 | |
| PIT | P.Harvin | 0.623 | 35% | 69 | |
| TB | J.Camarda | 0.621 | 41% | 79 | |
| NYJ | B.Mann | 0.621 | 39% | 83 | |
| ARI | A.Lee | 0.599 | 54% | 68 | |
| CHI | T.Gill | 0.598 | 46% | 67 | |
| LAR | R.Dixon | 0.596 | 49% | 73 | |
| NE | J.Bailey | 0.590 | 43% | 37 | |
| CIN | K.Huber | 0.574 | 35% | 31 | |
| NE | M.Palardy | 0.572 | 42% | 43 |
As expected, punters who net good yards despite high return rates also punt far. Stonehouse has been the best in the league by this metric, which measures how much of the available room (YTG) a punt travels.
Normalized Gross Yards vs Return Rate, Table sorted by normalized gross yards (Norm.Gross)

| Team | Name | Norm.Gross | Return% | Punts | |
|---|---|---|---|---|---|
| TEN | R.Stonehouse | 0.757 | 66% | 90 | |
| JAX | L.Cooke | 0.746 | 50% | 58 | |
| KC | T.Townsend | 0.742 | 42% | 53 | |
| LV | A.Cole | 0.738 | 42% | 59 | |
| CLE | C.Bojorquez | 0.733 | 43% | 61 | |
| HOU | C.Johnston | 0.728 | 51% | 88 | |
| CAR | J.Hekker | 0.726 | 33% | 81 | |
| MIA | T.Morstead | 0.725 | 51% | 61 | |
| SF | M.Wishnowsky | 0.719 | 28% | 61 | |
| DET | J.Fox | 0.714 | 58% | 52 | |
| SEA | M.Dickson | 0.709 | 53% | 66 | |
| WAS | T.Way | 0.707 | 41% | 83 | |
| MIN | R.Wright | 0.707 | 51% | 74 | |
| ATL | B.Pinion | 0.704 | 40% | 62 | |
| NO | B.Gillikin | 0.702 | 34% | 77 | |
| DAL | B.Anger | 0.700 | 47% | 68 | |
| BAL | J.Stout | 0.695 | 39% | 57 | |
| BUF | S.Martin | 0.690 | 35% | 46 | |
| PHI | A.Siposs | 0.690 | 44% | 45 | |
| TB | J.Camarda | 0.686 | 41% | 79 | |
| GB | P.O'Donnell | 0.685 | 37% | 54 | |
| DEN | C.Waitman | 0.680 | 46% | 96 | |
| NYJ | B.Mann | 0.680 | 39% | 83 | |
| NYG | J.Gillan | 0.678 | 37% | 75 | |
| LAC | J.Scott | 0.678 | 26% | 73 | |
| ARI | A.Lee | 0.665 | 54% | 68 | |
| IND | M.Haack | 0.665 | 37% | 71 | |
| LAR | R.Dixon | 0.664 | 49% | 73 | |
| CHI | T.Gill | 0.654 | 46% | 67 | |
| NE | J.Bailey | 0.650 | 43% | 37 | |
| PIT | P.Harvin | 0.649 | 35% | 69 | |
| CIN | K.Huber | 0.649 | 35% | 31 | |
| NE | M.Palardy | 0.608 | 42% | 43 |
As shown in Part I, return rate increases with YTG, as some punters seek to maximize distance above all alse.
The same relationship is seen for the 2022 season. The regression line/area shows the expected return rate, given a punter's average YTG.
While Stonehouse has had relatively high YTG, his return rate is still much higher than is typical for the league.
Let's look at Wishnowsky (SF) and Townsend (KC), the tops in the league by
normalized net yards, as an another example. Wishnowsky has been the best in the league at minimizing returns, and on the surface
it seems his style may be similar to Kern's. But the graph shows his return rate is within expectation, given his shallower punts.
Townsend has allowed an average return rate overall, but it is lower than expected for his average punting room.
His performance may be considered more impressive, as he is achieving similarly from greater distance. To his credit, Wishnowsky
is maximizing his opportunity, relative to someone like Bailey (NE).
Return Rate vs YTG, 2022 punts

The regressions shown on the these charts were fit using the table data, which has already grouped and averaged punts by 2022 punters. Despite this limited data source, the fit shown for Return Rate vs YTG is basically the same as the logistic regression fit to all punting data from 2009-2021, within the YTG range presented.
Additional charts with limited or no analysis are presented in the advanced metrics and extras. See Punters are Players for punters who went above and beyond in 2022.
Puntalytics era adjusted Punt EPA and their Adj. Net, "SHARP_RERUN", can be used interchangeably to compare punters. My simpler, Normalized Net, is not a bad approximation to their Adj. Net.


Classification of Pin Deep (shorter YTG) vs Open Field (longer YTG) territory shows Punter performance in different situations.
Adj Net*: Pin Deep vs Open Field
Table sorted by Punt EPA*. Open Field and Pin Deep columns refer to the Adj Net* score for the two punting territories.
| Team | Name | Punt EPA* | Adj. Net* | Punts | Open Field | Pin Deep | |
|---|---|---|---|---|---|---|---|
|
KC | T.Townsend | 0.233 | 107.2 | 44 | 100.8 | 110.2 |
|
TEN | R.Stonehouse | 0.207 | 106.3 | 87 | 101.6 | 107.9 |
|
LV | A.Cole | 0.190 | 106.4 | 55 | 104.9 | 107.3 |
|
CAR | J.Hekker | 0.180 | 105.9 | 70 | 109.6 | 103.9 |
|
CLE | C.Bojorquez | 0.179 | 105.5 | 53 | 103.1 | 107.3 |
|
JAX | L.Cooke | 0.122 | 104.1 | 49 | 100.2 | 106.1 |
|
HOU | C.Johnston | 0.115 | 104.6 | 78 | 111.8 | 101.3 |
|
DAL | B.Anger | 0.093 | 102.7 | 58 | 101.2 | 103.5 |
|
SEA | M.Dickson | 0.089 | 102.9 | 57 | 102.4 | 103.0 |
|
WAS | T.Way | 0.085 | 102.9 | 74 | 101.1 | 103.7 |
|
NO | B.Gillikin | 0.077 | 102.2 | 66 | 99.0 | 104.2 |
|
BUF | S.Martin | 0.060 | 101.1 | 43 | 97.9 | 102.6 |
|
MIA | T.Morstead | 0.060 | 100.3 | 53 | 102.3 | 99.4 |
|
DET | J.Fox | 0.059 | 102.0 | 45 | 101.1 | 102.4 |
|
TB | J.Camarda | 0.044 | 101.2 | 69 | 97.7 | 102.4 |
|
SF | M.Wishnowsky | 0.034 | 101.6 | 54 | 105.8 | 96.4 |
|
MIN | R.Wright | 0.030 | 101.1 | 71 | 97.0 | 102.9 |
|
GB | P.O'Donnell | 0.021 | 101.6 | 49 | 107.8 | 98.0 |
|
ATL | B.Pinion | 0.004 | 100.5 | 56 | 103.7 | 98.7 |
|
LAR | R.Dixon | -0.022 | 99.1 | 62 | 90.0 | 101.0 |
|
NYJ | B.Mann | -0.029 | 99.2 | 75 | 104.0 | 97.1 |
|
BAL | J.Stout | -0.039 | 98.0 | 50 | 90.0 | 103.8 |
|
PHI | A.Siposs | -0.055 | 98.4 | 45 | 103.0 | 95.0 |
|
DEN | C.Waitman | -0.056 | 98.8 | 86 | 99.9 | 98.4 |
|
ARI | A.Lee | -0.057 | 98.1 | 63 | 99.3 | 97.7 |
|
LAC | J.Scott | -0.066 | 97.7 | 64 | 97.2 | 98.0 |
|
NYG | J.Gillan | -0.070 | 97.1 | 69 | 92.8 | 99.9 |
|
CHI | T.Gill | -0.074 | 97.8 | 57 | 97.9 | 97.8 |
|
IND | M.Haack | -0.125 | 95.8 | 65 | 98.1 | 94.6 |
|
PIT | P.Harvin | -0.128 | 96.2 | 64 | 101.4 | 94.4 |
|
CIN | K.Huber | -0.158 | 95.2 | 31 | 88.5 | 98.4 |
|
NE | J.Bailey | -0.283 | 90.9 | 37 | 92.8 | 89.1 |
|
NE | M.Palardy | -0.345 | 89.5 | 34 | 88.9 | 89.8 |


Punters are Players - 2022
2022 play-by-play data: plays where a punter passes/rushes/receives/tackles
EPA percentile is relative to the entire dataset's distribution,
QB epa used for passing.
The tables below show all passing, rushing, receiving, and tackling for punters in 2022. The offensive stats contain an EPA percentile column, which shows the punter's EPA/play relative to all plays in 2022. For example, rushing EPA/play is measured against all rushes with non-null EPA.
dataset updated on Mon Jan 9 15:24:21 2023
Punters are Players!
| Attempts | Y/A | Comp % | TD | Int | EPA/play | EPA percentile | |
|---|---|---|---|---|---|---|---|
| B.Mann NYJ | 2 | 8.5 | 50% | 0 | 0 | 0.45 | 65 |
| R.Dixon LAR | 2 | 9.0 | 100% | 0 | 0 | 2.69 | 95 |
| R.Wright MIN | 2 | 6.5 | 50% | 0 | 0 | -0.20 | 49 |
| A.Lee ARI | 1 | 4.0 | 100% | 0 | 0 | 2.86 | 96 |
| T.Townsend KC | 1 | 0.0 | 0% | 0 | 0 | -3.52 | 2 |
| J.Gillan NYG | 1 | 0.0 | 0% | 0 | 0 | -3.92 | 1 |
| J.Fox DET | 1 | 6.0 | 100% | 0 | 0 | 2.95 | 96 |
Week 12 - NYJ at CHI: (9:25) (Field Goal formation) 7-B.Mann to CHI 26 for -8 yards. FUMBLES, and recovers at CHI 26. 7-B.Mann pass incomplete short right [36-D.Houston-Carson].
Week 12 - KC at LA: (6:01) (Punt formation) 11-R.Dixon pass short right to 87-J.Harris to LA 47 for 6 yards (21-T.McDuffie).
Week 15 - MIN at IND: (11:06) (Punt formation) 14-R.Wright pass incomplete short left to 83-J.Nailor.
| Attempts | Y/A | First Down % | TD | Fumbles | EPA/play | EPA percentile | |
|---|---|---|---|---|---|---|---|
| M.Dickson SEA | 2 | -9.0 | 0% | 0 | 1 | -4.23 | 0 |
| T.Townsend KC | 1 | 0.0 | 0% | 0 | 0 | -0.95 | 10 |
| J.Gillan NYG | 3 | -1.0 | 0% | 0 | 1 | -1.99 | 1 |
| B.Anger DAL | 2 | 0.0 | 0% | 0 | 1 | -2.44 | 1 |
Week 6 - SEA at ARI: (:59) (Punt formation) 4-M.Dickson up the middle to SEA -2 for -12 yards (47-E.Turner). FUMBLES (47-E.Turner), RECOVERED by ARI-31-C.Banjo at SEA -4. TOUCHDOWN.
Week 5 - GB at NYG: (:15) (Punt formation) 6-J.Gillan left end ran ob in End Zone for -3 yards, SAFETY (81-J.Deguara). Penalty on NYG-27-J.Pinnock, Offensive Holding, declined.
Week 14 - NYG at PHI: (8:32) (Punt formation) 6-J.Gillan to NYG 33 for -10 yards. FUMBLES, touched at NYG 33, recovered by NYG-52-C.Coughlin at NYG 33. PENALTY on NYG-6-J.Gillan, Illegal Kick/Kicking Loose Ball, 10 yards, enforced at NYG 43.
Week 18 - WAS at DAL: (11:50) (Punt formation) 5-B.Anger FUMBLES (Aborted) at DAL 19, and recovers at DAL 19. 5-B.Anger to DAL 20 for 1 yard (46-M.Eifler).
| Solo | Asst | for Loss | |
|---|---|---|---|
| R.Dixon LAR | 2 | 1 | |
| M.Haack IND | 2 | ||
| J.Bailey NE | 2 | ||
| T.Morstead MIA | 3 | 1 | |
| J.Gillan NYG | 1 | ||
| R.Stonehouse TEN | 2 | ||
| J.Fox DET | 1 | ||
| A.Siposs PHI | 2 | ||
| M.Wishnowsky SF | 1 | ||
| J.Camarda TB | 5 | 1 |
Week 15 - GB at LA: (5:43) 11-R.Dixon punts 41 yards to GB 33, Center-42-M.Orzech. 25-K.Nixon pushed ob at 50 for 17 yards (11-R.Dixon). PENALTY on LA-21-R.Yeast, Face Mask, 15 yards, enforced at 50.
Week 4 - SF at LA: (13:32) 11-R.Dixon punts 56 yards to SF 23, Center-42-M.Orzech. 3-R.McCloud to SF 45 for 22 yards (11-R.Dixon, 34-J.Funk).
Week 15 - MIN at IND: (10:42) 6-M.Haack punts 43 yards to MIN 25, Center-46-L.Rhodes. 5-J.Reagor to IND 24 for 51 yards (6-M.Haack). PENALTY on MIN-29-K.Boyd, Face Mask, 12 yards, enforced at MIN 25.
Week 5 - NE at DET: 7-J.Bailey kicks 65 yards from NE 35 to DET 0. 15-M.Alexander ran ob at DET 47 for 47 yards (7-J.Bailey).
Week 6 - MIA at MIN: (7:29) 4-T.Morstead punts 62 yards to MIN 26, Center-44-B.Ferguson. 5-J.Reagor ran ob at MIA 49 for 25 yards (4-T.Morstead).
Week 12 - MIA at HOU: (11:58) 4-T.Morstead punts 52 yards to HOU 16, Center-44-B.Ferguson. 1-T.Smith pushed ob at HOU 33 for 17 yards (4-T.Morstead).Week 12 - MIA at HOU: (7:25) 4-T.Morstead punts 55 yards to HOU 15, Center-44-B.Ferguson. 1-T.Smith ran ob at HOU 41 for 26 yards (4-T.Morstead; 43-A.Van Ginkel).
Week 14 - TEN at JAX: (5:29) 4-R.Stonehouse punts 53 yards to JAX 42, Center-46-M.Cox. 39-J.Agnew ran ob at JAX 49 for 7 yards (4-R.Stonehouse). PENALTY on JAX-6-C.Claybrooks, Offensive Holding, 10 yards, enforced at JAX 47.
Week 6 - PHI at DAL: (6:59) 8-A.Siposs punts 59 yards to DAL 5, Center-45-R.Lovato. 9-K.Turpin to DAL 39 for 34 yards (8-A.Siposs). PENALTY on DAL-1-K.Joseph, Offensive Holding, 7 yards, enforced at DAL 14.
Week 9 - TB at LA: 5-J.Camarda kicks 67 yards from TB 35 to LA -2. 19-B.Powell to LA 27 for 29 yards (5-J.Camarda).
Week 9 - TB at LA: (14:17) 5-J.Camarda punts 53 yards to LA 23, Center-97-Z.Triner. 19-B.Powell pushed ob at TB 35 for 42 yards (5-J.Camarda). PENALTY on LA-21-R.Yeast, Offensive Holding, 10 yards, enforced at LA 35.
Week 13 - TB at NO: (5:05) 5-J.Camarda punts 50 yards to NO 18, Center-97-Z.Triner. 89-R.Shaheed pushed ob at TB 40 for 42 yards (5-J.Camarda). NO-53-Z.Baun was injured during the play. His return is Questionable.
Week 17 - TB at CAR: 5-J.Camarda kicks 63 yards from TB 35 to CAR 2. 20-R.Blackshear to CAR 38 for 36 yards (5-J.Camarda).Week 5 - TB at ATL: 5-J.Camarda kicks 63 yards from TB 35 to ATL 2. 35-A.Williams to ATL 32 for 30 yards (5-J.Camarda; 41-K.Kieft).
Playground
Section for small-form analyses . . .
Third Down Rushing Conversions, 2022
High conversion rates were related to less required yards for a first down. Rush attempts were grouped by team.
To be added: What were possible causes and consequences of Derrick Henry's low 3rd down usage?
Receivers by CPOE/target or reception
utilize a passing metric, completion percent over expected, to identify most QB-friendly WRs
QB/Team by percentage of passing EPA from YAC
investigate some narratives surrounding offenses that create YAC opportunities or QBs whose stats are inflated by production after the catch
Titans drive stallage / negative plays
covered in 2022 review, see per Drive Analyses
Derrick Henry
to be determined . . .